Have you ever had a dataset that contains too many points to see a clear pattern at the scale you wish to view your map? With today’s new release of ArcGIS Online, clustering is now available to help in this very situation, allowing you to find new patterns that are otherwise hidden.
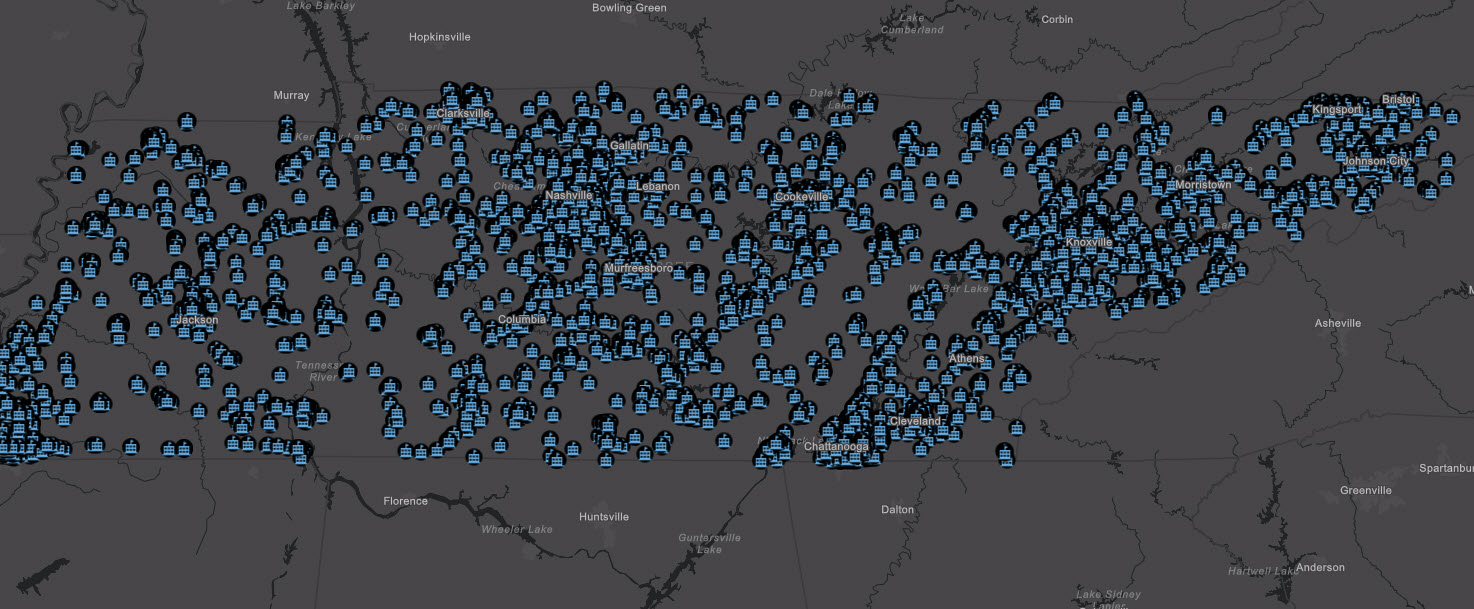
For example, here’s a look at Tennessee Public Cooling Centers without clustering:
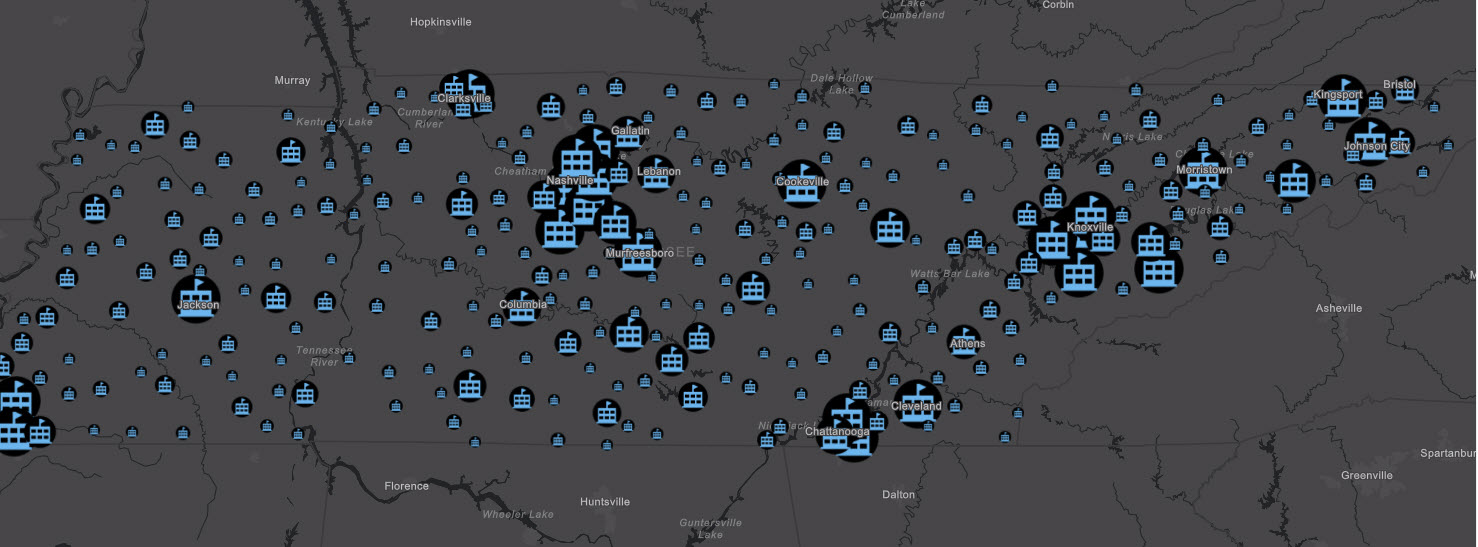
Compare that to Tennessee Public Cooling Centers with clustering:
Here’s a simple guide to clustering for data exploration:
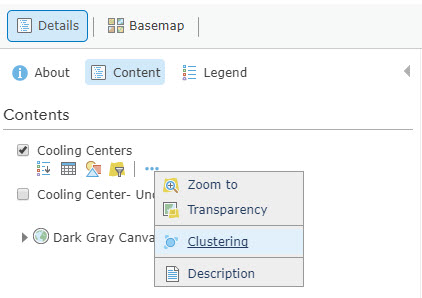
Step 1: Simply select clustering to cluster your points. If your feature layer contains points, the clustering option will appear in the More menu:
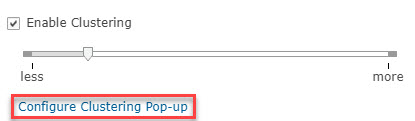
Next, use the slider to decide how much clustering you want to use:
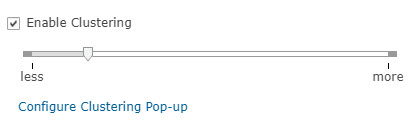
Less clustering (less generalization/aggregation/grouping) yields more dots on the map, and conversely, more clustering (more generalization/aggregation/grouping) yields fewer. As you zoom in and out, the clusters update based on your current map scale. Clusters are proportionally sized by the count of features to visually cue the map reader that there are more items clustered in one location vs. another.
Before clustering, there were very few options to display this information: labeling, in which the map reader had to read every label to even begin to assemble the picture; or heat mapping, which is great for lots of coincident points, but qualitatively different from depicting a cluster of points near each other. “Near” can mean different distances at different scales, and clustering naturally adjusts the size and quantity of clusters based on the current map scale.
Step 2: Explore your data’s attribute fields.
Categorical Attributes
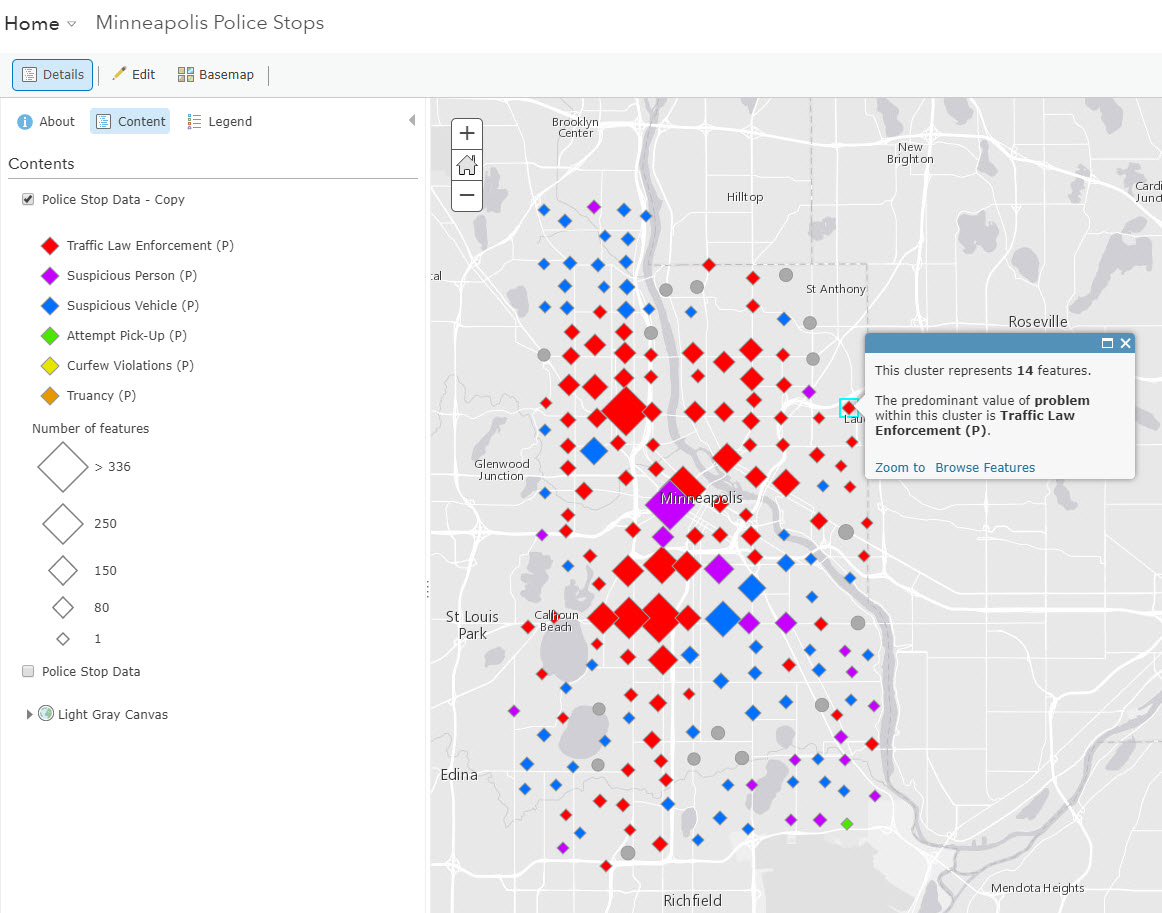
Say you have a points layer of police stops with an attribute containing the type of police stop each is. Click on the Change Style menu, choose an attribute to show, and select the Types (Unique Symbols) option to pick your colors. Next, select clustering in the More menu.
After selecting clustering, the default pop-up will tell you how many features one cluster represents. If a small cluster only represents one feature, the traditional pop-up containing that feature’s information is displayed. Here, since our points are symbolized by categories, the predominant category in each cluster will appear. For example, in our layer of Minneapolis Police Stops, we see this:
Numeric Attributes
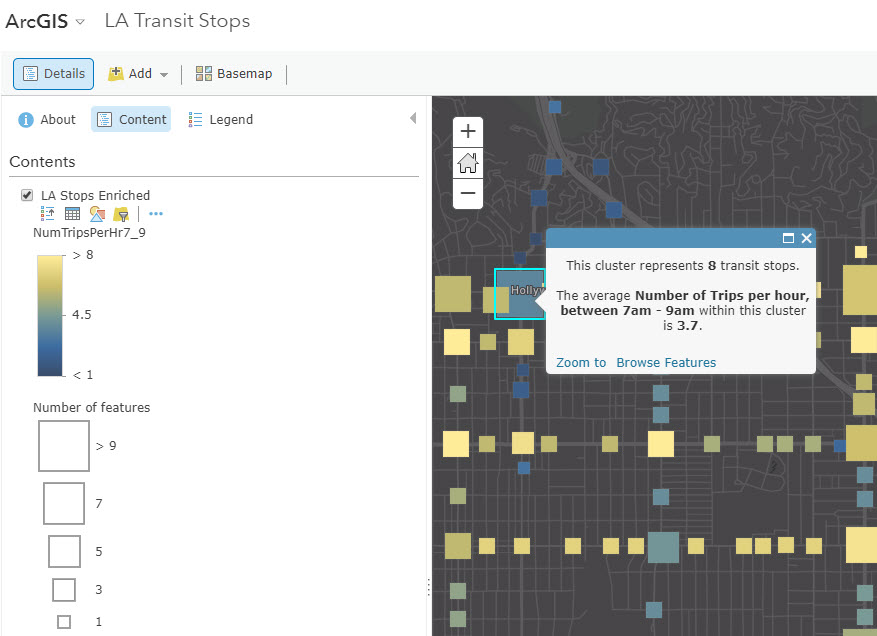
Clustering works with numeric attributes as well. To map a numeric attribute, click on the Change Style menu, select the numeric attribute you want to display. In this layer of Los Angeles Transit Stops, one of the attributes is the number of trips per hour in the morning rush hour (between 7am and 9am). Each stop has a number of stops per hour in this field, and as the points get clustered, we can get an average to display in the pop-up. Just as with the categorical fields above, whatever is currently symbolized will appear automatically in the clusters’ pop-ups. Here, we see the average number of stops displaying in the pop-up.
To truly customize your clusters’ pop-ups, click Configure Clustering Pop-up in the Clustering menu.
Step 3: Add a filter to subset your data and clean up the noise.
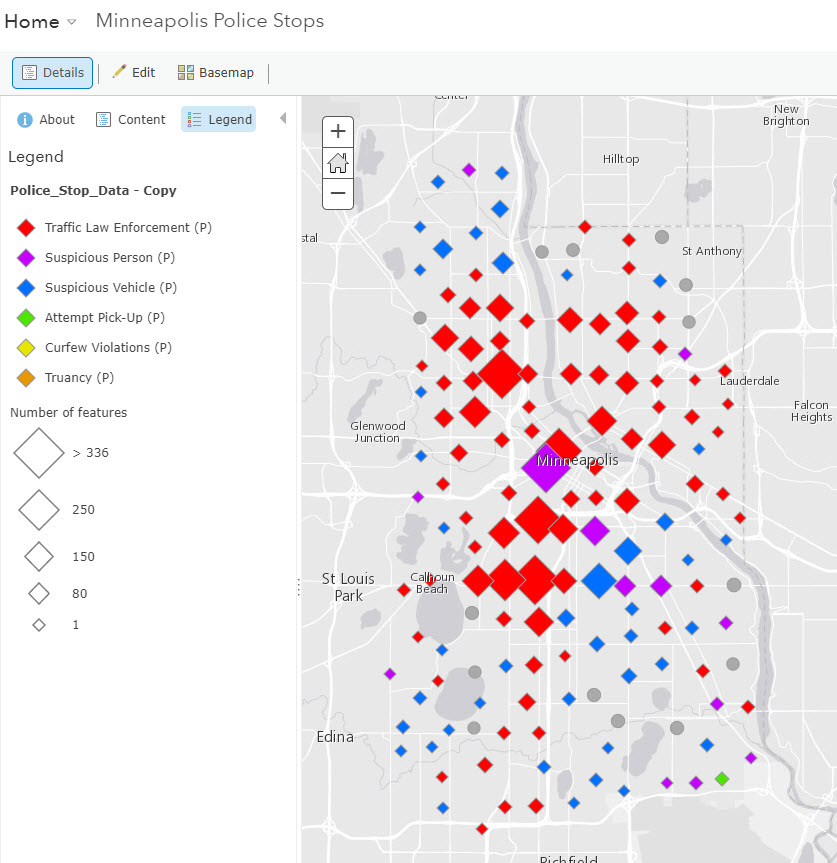
Using clustering with filters can be a powerful way to see more nuance in your data. Going back to the Minneapolis Police Stops, say you’re only interested in stops for curfew violations – a small percentage of total stops – which does not show up on the predominance cluster map.
First, simply filter your data such that only stops for curfew violations are displayed, then select clustering. Now we see clusters where there are a lot of police stops for curfew violations only, something that got lost in the first predominance map!
vs.

Advanced Tips and Tricks with Clustering
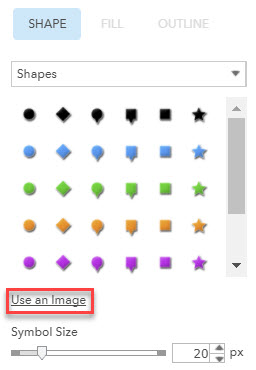
One way to make your clusters pop is to use an image as your symbol. For example, say you are creating clusters of all U.S. Dunkin’ Donuts locations. You could use a pink or orange circle/diamond/square, but to take your map to the next level, why not use the logo to get a more interesting map?

To do this, simply upload a small image as an item in your ArcGIS Online Content. Share and copy the link to the hosted image. Then, in the Change Style menu, select Use an Image, and paste the link to your image. Experiment a bit with the symbol size, and let your map sing.
A great way to display more context to your map readers is to display two layers: your clustered layer, and the original layer in a subtle, small symbol. Here we have a map of Hurricane Harvey SOS Rescues. The clusters are the proportionally-sized squares, and the small dots are the individual features. You can even adjust the transparency of the original features to make them more subtle compared to the clusters.
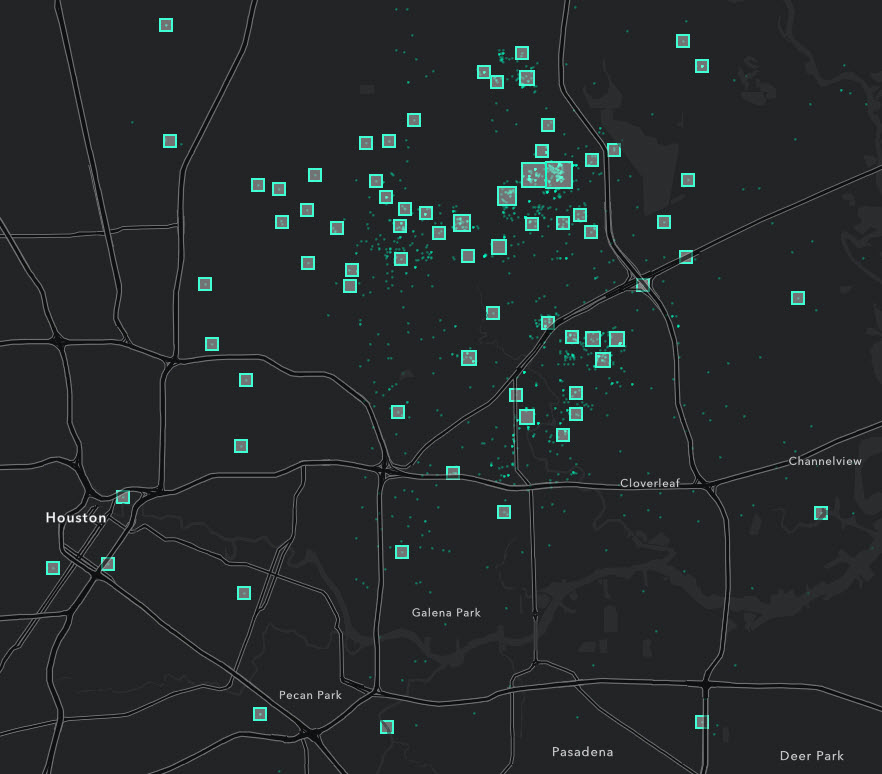
This shows the map reader the clustering, but also the geographic distribution of the original points. It gives the map reader an automatic sense of how many points one cluster might represent, as well as how spread out the points are.
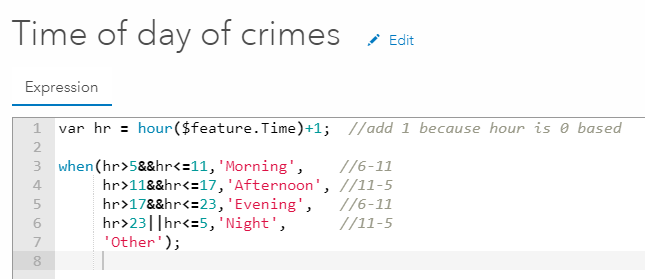
A final advanced tip is to use clustering with Arcade Expressions. Arcade expressions allow you to construct new attributes from your existing data and map your ideas. Say we have a layer of arrests in San Francisco. We’ve already applied a filter for the specific crime of interest to us: public drunkenness. We’re interested in creating a categorical field (morning, afternoon, evening, and night) based on our existing field: time. We can use Arcade to write an expression and create a new field:
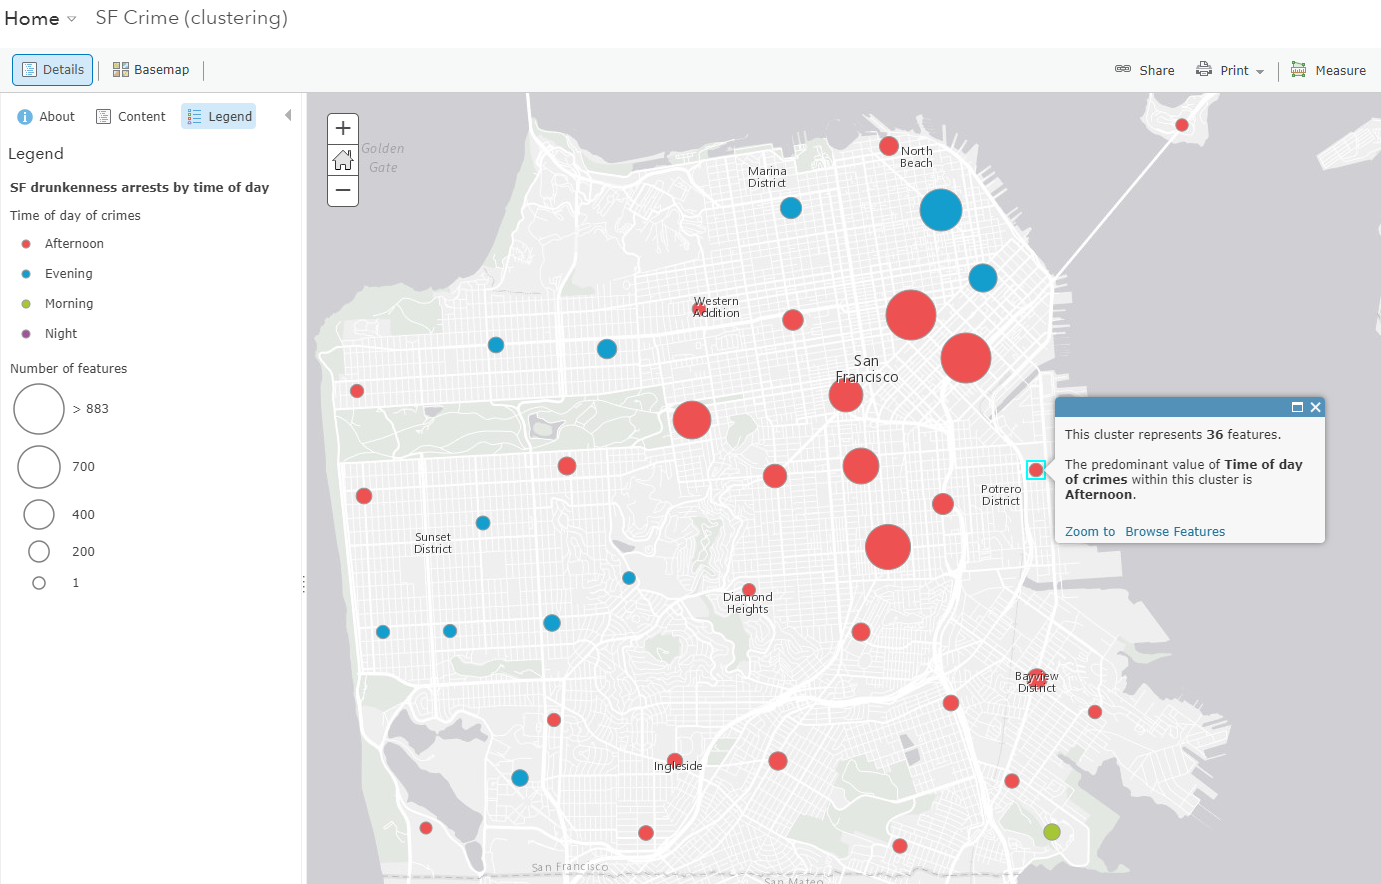
Now that our map is symbolized by this new categorical attribute, when we apply clustering, we’ll get the predominant category to appear:
Putting it all together
Some of the best maps will combine these tips and tricks. For example, this map of sales volume for store locations of a particular business uses both an image to symbolize, and the ability to display an average in the pop-up:

More Benefits of Using Clustering
Clustering “forgives” imperfect x/y or lat/long location data. Imperfect x/y or lat/long values imply that your points are more precise than they really are. Clustering makes this lack of precision irrelevant. Clustering uses multiple locations to place the cluster, so the error in one feature will cancel out the error in another feature. Of course, this assumes the error across your locations is independent and identically distributed (not systematically erring in one direction, for example).
The biggest benefit of clustering is that now, map authors have one more tool for data exploration and visualization. Data exploration and visualization is often just the first step to working with data, and can inspire ideas for actual analysis. Let the inspiration begin!
Clustering works with any hosted feature layer or feature layer served from ArcGIS Server 10.3.1 or higher with pagination support. Right now, clustering works with feature layers containing up to 50,000 features. All features are downloaded and clustered on the client. In a future release, clustering will be an option that can also be seamlessly enabled on the service itself, eliminating the need to download the entire dataset to the client. Clustering is currently only supported in ArcGIS Online 2D web applications along with the upcoming 3.22 version of the ArcGIS API for JavaScript. Support across the platform (Pro, Runtime, JSAPI 4.x, & ArcGIS Apps) will come in 2018. If you author a web map that has clustering enabled and view it in a client that does not currently support clustering, the features will display as if they were not clustered.
For a full interactive guide on using clustering in ArcGIS Online, visit this story map on Clustering. The official clustering help page and a quick video tutorial are also available.
(Last updated on Sept. 27, 2017)

Commenting is not enabled for this article.