How do you make a web map if the layer you are using does not contain the exact attribute field that you need? With the December release of ArcGIS Online, you can now use Arcade expressions to get your basic mapping work done, as well as imagine powerful new map products, without having to edit the source data.
It used to be the case that when the map layer you’re working with does not contain the exact data you need, you were stuck. Until now, you would need to obtain the source data, add a field to it, and calculate the exact thing you need. Or, you would have an app developer write custom code to calculate exactly what you need.
For decades, the process for making a map included two basic steps: get the data, and symbolize it, often using one of its attribute fields. If the data did not contain the exact field you need, you could always contact the data’s creator and ask them, nicely, to create what you need. While that can work in certain circumstances, data owners cannot respond to increasing numbers of such requests.
The alternative: download the data, add/calculate the field you need, and host it yourself. Inefficient, but it works. What if there were a better way?
ArcGIS Online now includes and utilizes Arcade expressions. Arcade expressions, described in full here, allow you to make maps from simple calculations, from functions, from data conversions, and from brand new representations of your data.
Because Arcade expressions are calculated on the fly, you do not need to add a field or permanently calculate its values. This makes it far easier to utilize the map layers and data already out there.
For example, my colleague hosted a dataset with fields representing samples of water quality in my local rivers. My manager wants to see the average contamination levels of the water samples, but the dataset does not contain a field with the average. Using a simple expression, I can calculate the average value directly within the Change Style window using the service’s attributes. Ta da! Done in seconds! I can immediately show my manager the new map, without any data management work.
Expressions harness the power of the Arcade expression language. Arcade provides a simple syntax to calculate values, apply functions to data, use logic statements like IF…THEN, convert data and more. In terms of mapping, use Arcade expressions to map the results of your function, create and map custom categories, set transparency based on an expression, or rotate symbols based on an expression.
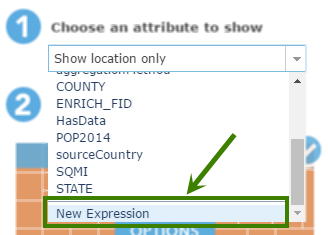
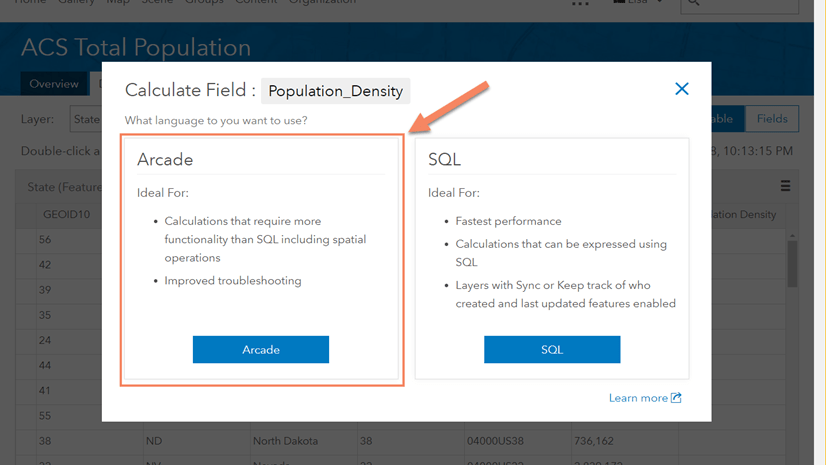
To use expressions in ArcGIS Online, go to your layer’s “Change Style” button to start. In the list of attributes, scroll to the bottom and choose “New Expression” to define a new expression by which your map will be drawn.
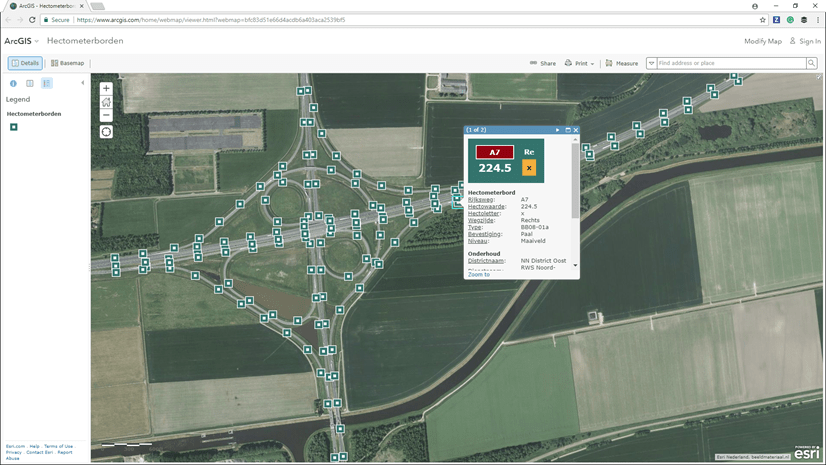
A scripting window appears, alongside a list of the layer’s attributes and their aliases.
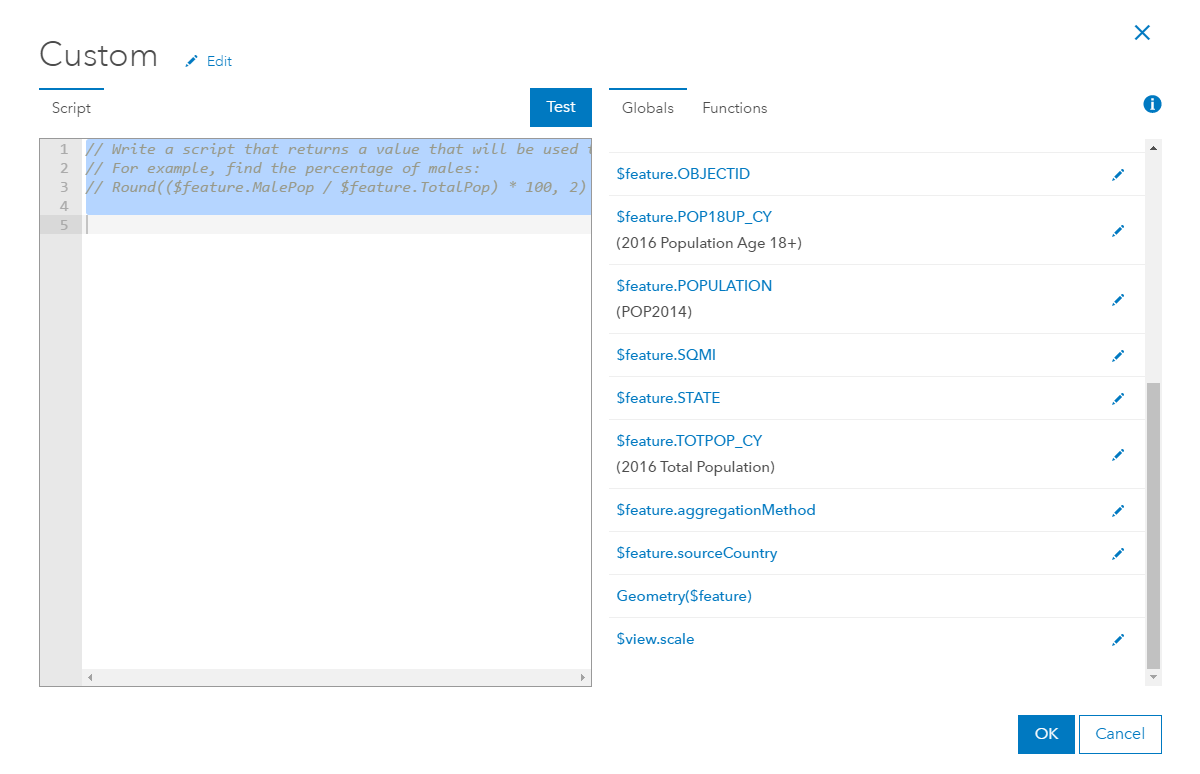
Let’s make a simple expression. Write a simple equation to calculate the value you want, and when you hit “Ok,” your map will now reflect the results of that calculation.
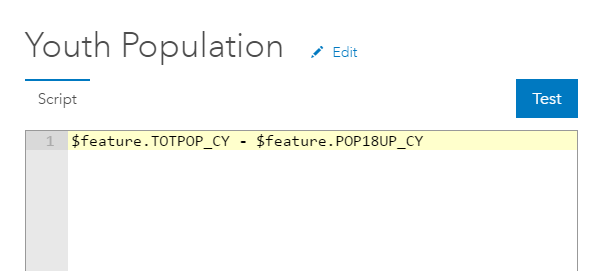
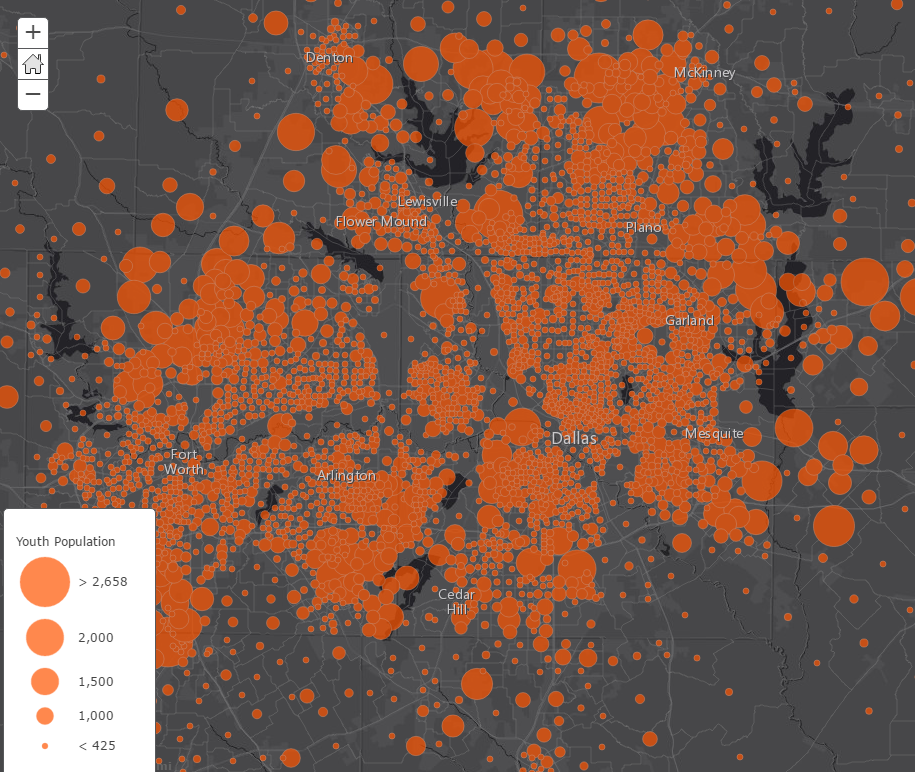
For example, I have found a dataset showing the population of adults, age 18 and over, in Dallas, Texas. However, I want to explore patterns for all youth (age < 18) in the area. I wish my dataset already had an attribute field called “AgeUnder18” or something like that, but it does not.
Instead, I simply calculate it. I double-click on the Total Population attribute, and then type the minus sign, and lastly I double-click on the “Population 18+” to complete the expression. I hit the “Test” button to verify that it generates a reasonable value for a sample record.
Simple expressions are needed for so many useful maps: maps that show percentages (when you were only given attributes with counts); maps that show summations of two or more counts; maps that just need basic math. Expressions are for anyone who can do basic math!
Equally exciting are the logic and functions available in Arcade expressions. You can create variables, use if statements, use equations, and many more things. If you’re comfortable writing expressions in Excel or statistics packages, you’ll love Arcade.
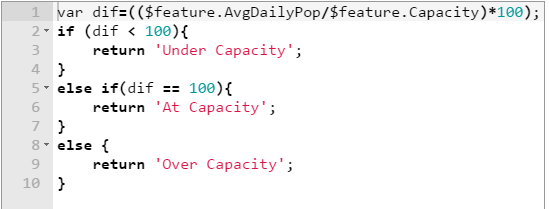
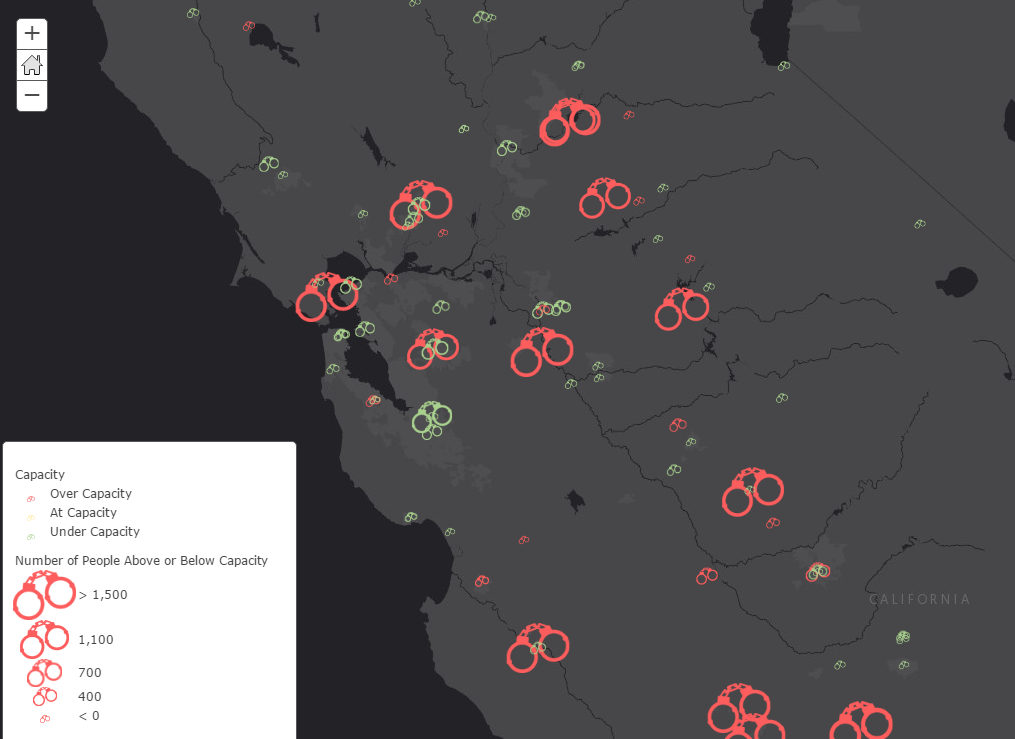
The following dataset contains information about prisoner figures for California. An expression was used to help create context about not only the number of prisoners, but also the relationship to capacity levels. Red locations are above capacity. Green locations are below capacity.
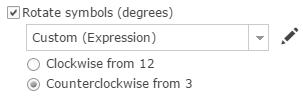
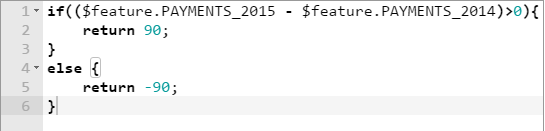
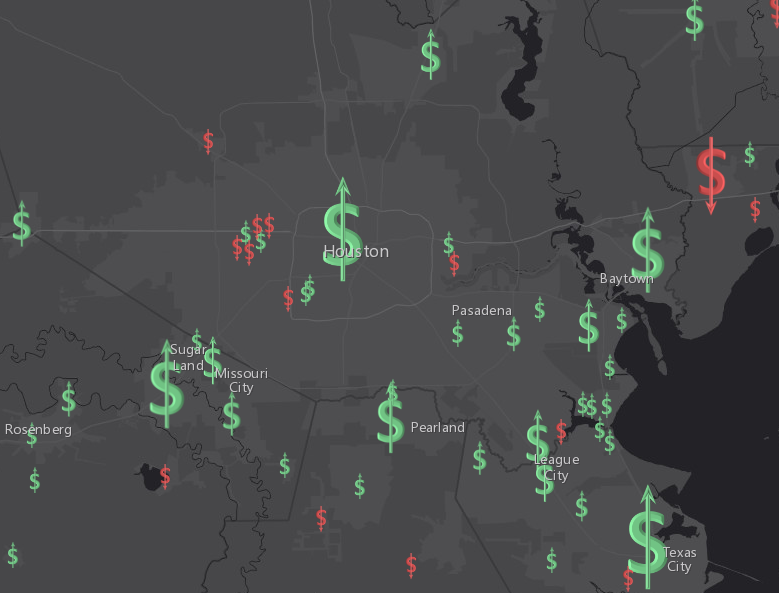
Expressions can also be used to set visual variables on the map, such as transparency of features, and the rotation of symbols. The following map uses an expression to rotate symbols to show the increase or decrease of sales tax revenue in Texas cities:
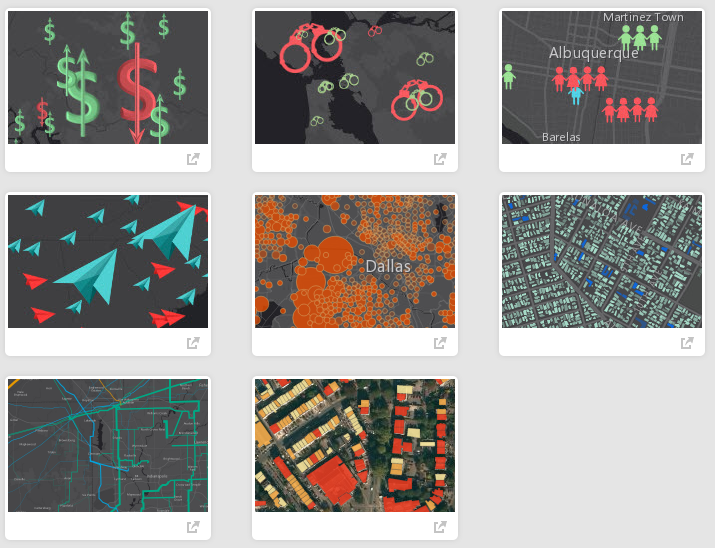
Feel free to explore the settings used in maps shown in this blog in order to see examples of expressions in action. For these maps, and other maps using arcade expressions, visit the following Gallery. Also, look out for future blogs about more ways to utilize Arcade expressions in ArcGIS Online.
For documentation and a playground to help get started, visit the Arcade documentation page.


Article Discussion: