In December 2014, the US Geological Survey (USGS) and Esri announced the publication of the most detailed global ecological land units map in the world. This exciting global data set provided a science platform for better understanding and accounting of the world’s resources. Scientists, land managers, conservationists, developers, and the public use this map to improve regional, national, and global resource management, planning, and decision making.

The collaborative partnership between Esri and USGS resulted in a dynamic online map representing the world’s ecological diversity at unprecedented detail and authority. This work leveraged quantitative methods, geographic science, and big data produced by government agencies and the scientific community. To create this map the data were processed in Esri’s ArcGIS cloud computing environment. This map provides new knowledge and understanding of geographic patterns and relationships by distinguishing the geography of the planets’ ecosystems.
To better understand the significance of the new Global Ecological Land Units (ELUs) map and the data behind it, I recently met with project leads, Roger Sayre, Ph.D., Senior Scientist for Ecosystems, USGS, and Randy Vaughan, Manager of Content Engineering, Esri.
What is Global Ecological Land Units map?
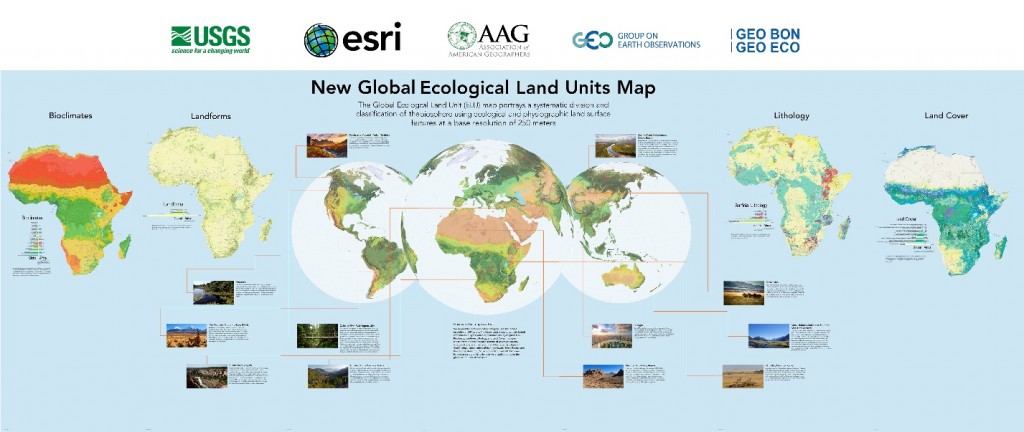
Roger Sayre, USGS: The Global ELUs map portrays a systematic division and classification of the biosphere using ecological and physiographic land surface features.

How was this map created?
Randy Vaughan, Esri: The globe was divided in cells (Ecological Facets) at a base resolution of 250 meters. The Facets were then characterized (attributed) with four input layers that drive ecological processes: bioclimate, landform, lithology, and land cover parameters. The layers chosen were the best available in terms of accuracy, currency, and global coverage. The result was a global raster data layer with 47,650 unique combinations of the four input layers. The Facets were then aggregated into 3,923 ecological land units (ELUs).
Why was it created?
Roger Sayre: The Global ELU project goals are twofold. The first goal is to provide, for the first time, a web-based, GIS-ready, global ecophysiographic data product for land managers, scientists, conservationists, developers, and the public to use for global, regional, and landscape analysis and accounting.
Second, the Global ELU map advances an objective, repeatable big data approach to the synthesis and classification of ecologically important data layers into distinctive and meaningful geo-referenced land units.
Can you give me some examples of what people might do with this data?
Randy Vaughan: The ELUs and other potential ecological facet aggregations provide an accounting framework to assess ecosystem services, such as carbon storage and soil formation, as well as risks such as environmental degradation.
The ELUs also lend themselves to the study of ecological diversity, rarity, and evolutionary isolation. For example we can identify whether the most diverse landscapes in terms of proximity to the most unique ELUs are protected. Understanding diversity can point the way to conservation and preservation planning.
Roger Sayre: While ELUs do not definitively characterize ecosystems at multiple scales, they do provide information and pointers to the ecological patterns of the globe. They will be useful for constructing research agendas and for understanding global processes such as climate change. For example, the data will be important to the study of environmental change. The automated approach to the objective classification of ELUs means that the mapping can be updated as better or more current input layers become available.
Agro-ecological zoning is based on the synthesis of land feature information, climate, and crop characteristics. The Global ELUs data will support the analysis and formulation of agro-ecological zoning by providing a standard foundation or starting point for zonation.
Are there future plans for the Global Ecological Land Units map?
Roger Sayre: There are known and expected deficiencies in the current input layers given the difficulty of mapping any phenomenon at the global level. The objective of the USGS and Esri is that the underlying data layers will be improved and updated. Users of the ELU data may help by documenting deficiencies in the current layers and suggesting improvements to the data structures to facilitate synthesis and analysis. The Global ELU team will seek collaborators to improve the data and will continue its own program of data improvement. For example the release of the new SRTM 30 meter elevation terrain data provides an opportunity create a higher resolution landforms map.
Randy Vaughan: The approach used to aggregate and classify data may also be used for other endeavors such as human geography. We are in the early stages of investigating what combinations of human and cultural data might be usefully combined. We note that the data production is more than just a land unit classification; all of the underlying data is available on ArcGIS Online for GIS analysis.
How can people get access to the Global ELUs map?
- Introductory Story Map to the ecological land units: esriurl.com/elu
- Explore the online application: esriurl.com/EcoTapestry
- Learn more about ecological land units: www.aag.org/global_ecosystems
- Get started using this content in ArcGIS: ArcGIS Online Landscape Layers Group