Exciting news from the Arctic! Version 2 of the Arctic DEM has been released. Topographic elevation of the Arctic can now be viewed and analyzed like never before. This release extends the detailed 2 meter Alaska elevation data with additional 2m data for Novaya Zemlya and Franz Josef Land, as well as preliminary 8 meter data for the entire Arctic. Additional detailed 2 meter elevation data will be released in quarterly installments over 2017 until the arctic data is complete. This is the result of a partnership between Esri, the National Geospatial Intelligence Agency, the National Science Foundation, and the Polar Geospatial Center at the University of Minnesota.
In September 2016, the White House hosted an Arctic Ministerial meeting, with over 20 countries represented, where this data was showcased and new commitments on data provisions were sought. The goal of the meeting and the function of the new data is to help people better understand, adapt to, and address the changing conditions in the Arctic.
The four key themes include:
- Understanding Arctic-Science Challenges and their Regional and Global Implications.
- Strengthening and Integrating Arctic Observations and Data Sharing.
- Applying Expanded Scientific Understanding of the Arctic to Build Regional Resilience and Shape Global Responses.
- Using Arctic Science as a Vehicle for Science, Technology, Engineering, and Math (STEM) Education and Citizen Empowerment.
To access the data, start with the NGA Arctic Support story map here and spend time on the ‘Arctic Digital Elevation Model (ArcticDEM) tab. The embedded apps provide interactive access to the elevation. The data is described in an article here from Medium.com and an article from National Geographic here. This story map illustrates the visualizations that can be generated with the click of the mouse for any user selected area, and a swipe story map explains the background on Digital Elevation Models and compares the new elevation data to the older elevation data by providing the ability to swipe between the maps. The DEMs have been computed from high resolution stereo Digital Globe satellite imagery.
The DEM Explorer is a web app that allows the data user to zoom to any area and review different visualizations such as hillshade, slope, aspect, contours. As the data is temporal in many areas, users can see how the data is changing over time and summarize elevation change for a selected area. The Change Viewer is a simpler app that allows a user to click a point and graphically view the historical elevation of that location. Access to these services is also available in a wide range of applications through the Arctic DEM Group in ArcGIS Online. Most of the apps use the polar projections to reduce distortions which would become severe in generic mapping applications. Finally, a video tour of the story map highlights many of the above products and services.
Quite a bit of publicity and press surrounds these data sets, but all of it is good news. Don’t let the flood of information prevent you from taking the time to investigate these resources and spend some time exploring the Arctic. The actual data is accessible through the web services, and will be of great benefit for anyone doing research in the Arctic, as the map below should make very clear.
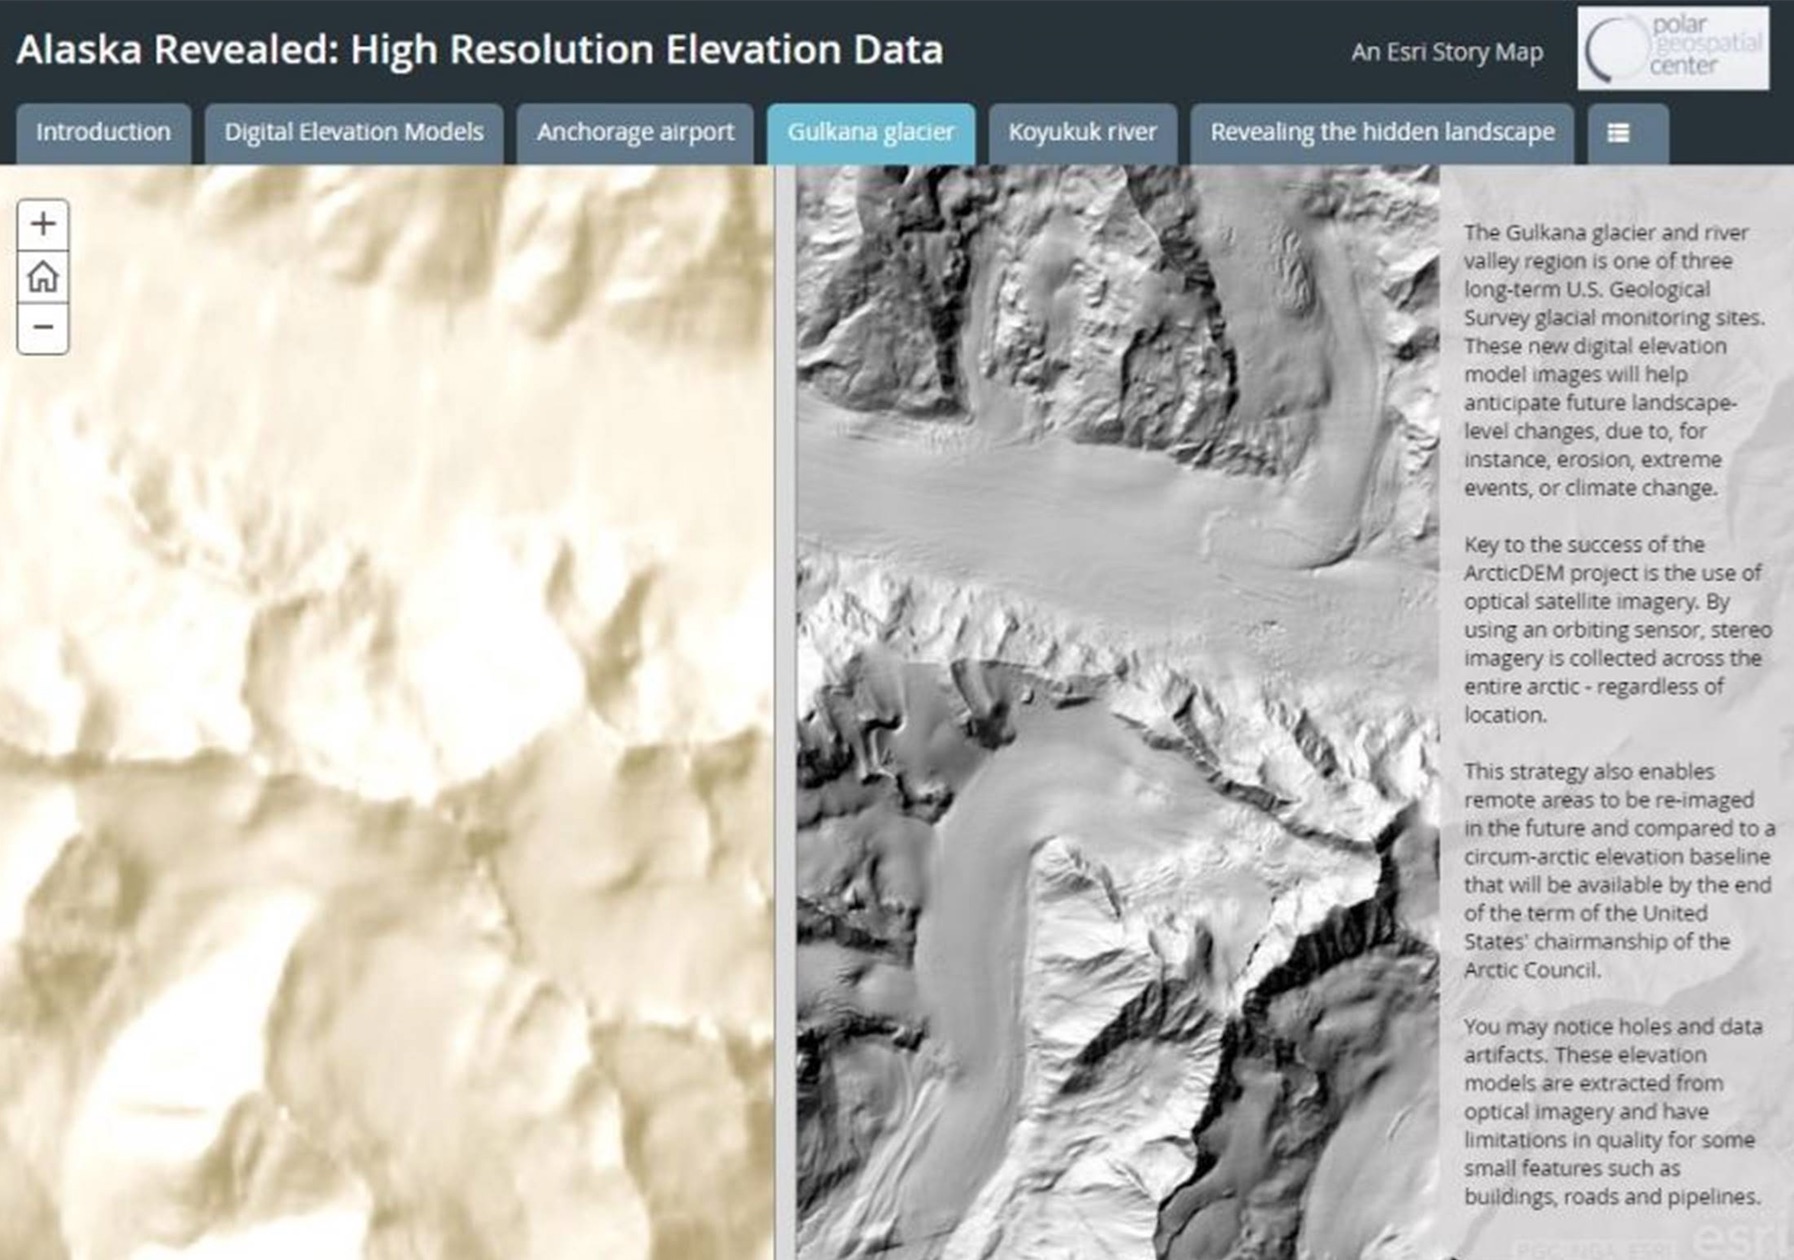
Alaska DEMs showing the heretofore available data (left) and the new data (right).