Getting the z-terminology straight
Maps and Scenes
GIS content can be displayed in 2D or 3D views, and there are a lot of similarities between the two modes. For example, both contain GIS layers, both have spatial references, and both support GIS operations such as selection, analysis, and editing.
However, there are also many differences. At the layer level, telephone poles might be shown in 2D as brown circles, while the same content in 3D could be shown as volumetric models—complete with cross members and even wires—that have been sized and rotated into place. At the scene level, there are properties that wouldn’t make sense in 2D, such as the need for a ground surface mesh, the existence of an illumination source, and atmospheric effects such as fog.
Local and Global
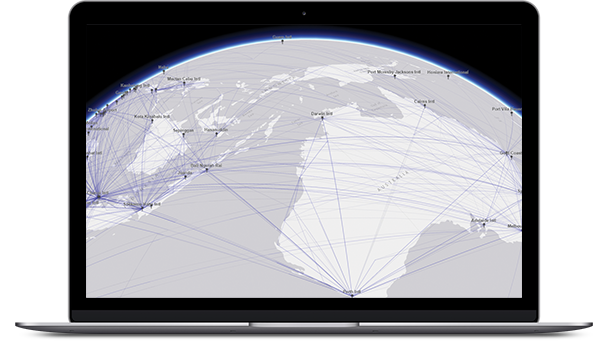
3D content can be displayed within two different scene environments—a global world and a local (or plane) world. Global views are currently the more prevalent view type, where 3D content is displayed in a global coordinate system shown in the form of a sphere. A global canvas is well suited for data that extends across large distances and where curvature of the earth must be accounted for, like global airline traffic paths or shipping lanes.

Surfaces
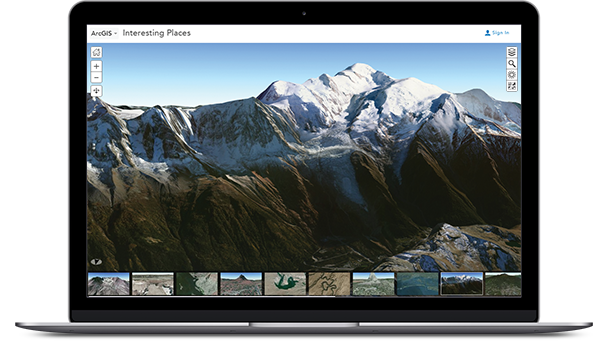
A surface is like a piece of skin pulled tight against the earth. Surface data by definition includes an x, y, and z value for any point on it. A surface can be a physical thing that exists in the real world, like a mountain range, or it can be an imagined surface that might exist in the future, such as a road grading plan. It can even show a theme that only exists conceptually, such as a population density surface. Surfaces come in a wide variety of accuracies, with anything from high-resolution, 1-inch accuracy all the way down to a low-resolution surface with 90 meters or coarser accuracy.
Real Size and Screen Size
Symbolizing features using a real-world size is extremely common in 3D. For example, it’s expected that buildings, trees, and light poles would all be displayed at the same relative size in the virtual world as they exist in reality. Even some thematic symbols, like a sphere showing the estimated illumination distance of one of the light poles, will help communicate the notion of a real-world size.
—–
This post is excerpted from The ArcGIS Book: 10 Big Ideas about Applying Geography to Your World. The twin goals of this book are to open your eyes to what is now possible with Web GIS, and then spur you into action by putting the technology and deep data resources in your hands. The book is available through Amazon.com and other booksellers, and is also available at www.TheArcGISBook.com for free.