Geography is the basis of everything that happens, and using Insights for ArcGIS we can turn geography into something much more meaningful.
Geography is the foundation of GIS. It’s the “where” in the chemistry of “where, why, and how.” GIS turns geography into something much more meaningful. It enables us to transform location into geographic understanding. We can learn where things happen, and more importantly, why. By using GIS analysis we can turn “I know where” into “I know why” or “I understand.” In other words, we can turn geographic information into insight.
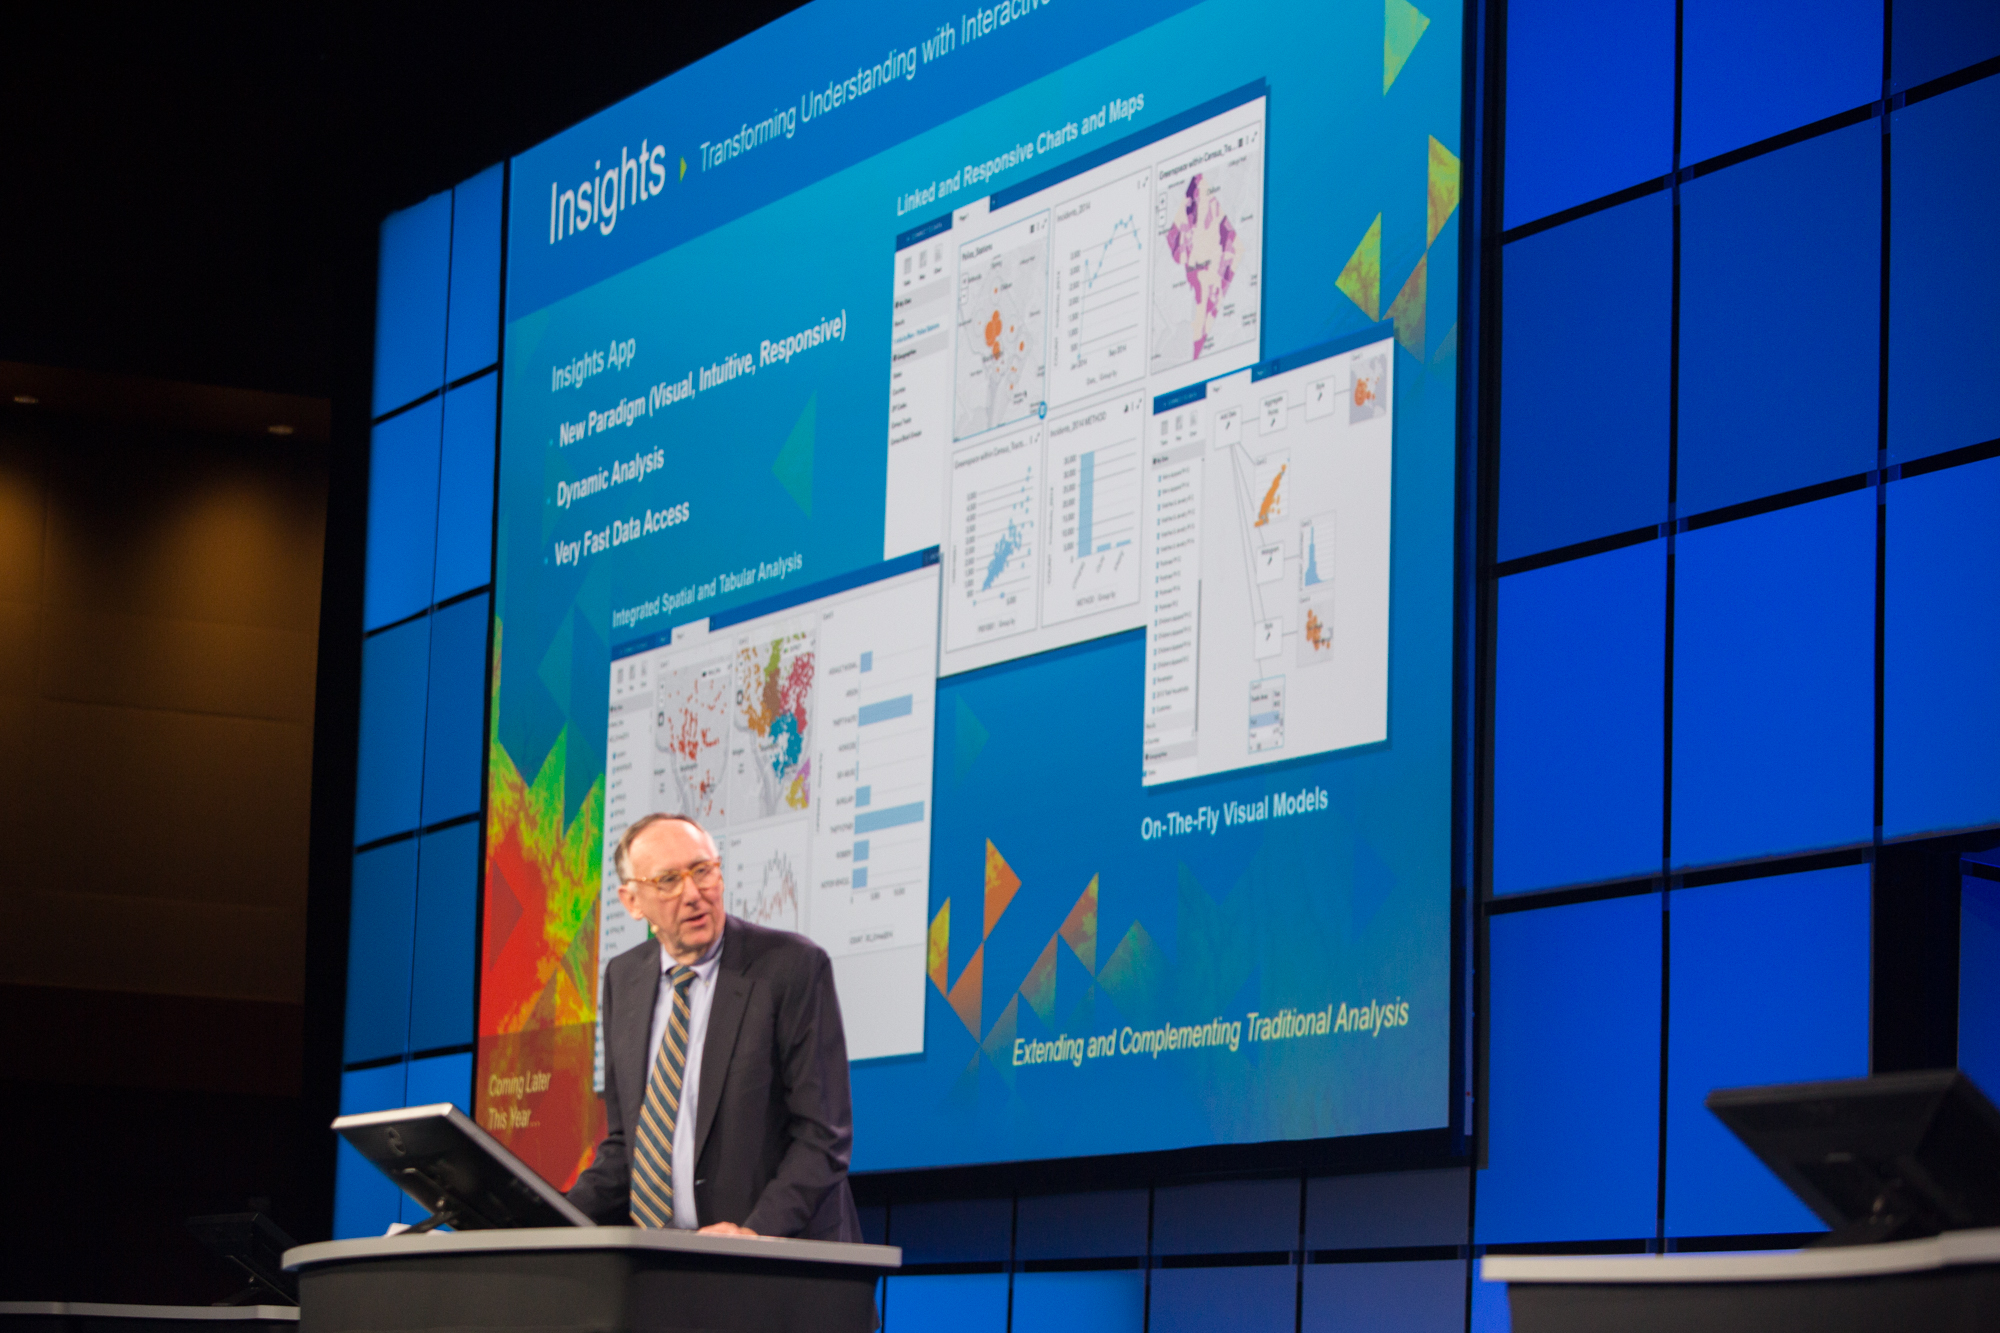
With that in mind, the announcement of a new application experience called Insights for ArcGIS at the recent Federal GIS Conference just might mark a milestone in the evolution of GIS.
In a similar fashion, Insights for ArcGIS represents not just an evolutionary step, but perhaps a revolutionary one. It empowers anyone to explore location-based data by applying interactive analysis to glean not only understanding, but insight. The proverbial aha! moment in true understanding.
Insights using your Enterprise Data
Enterprise data like that found in data warehouses and geodatabases, unfortunately, often sits in silos. It’s underutilized and very difficult to analyze all at once. These data often present challenges that may surface with respect to performance (queries taking too long), usability (complicated tools), or accessibility (disparate data sources). A unique aspect of Insights for ArcGIS is that it integrates enterprise data. From the back-end system to the user experience, Insights is designed to solve these problems and allow users to actualize the potential in their enterprise data.

Integration of Multiple Data Sources
The power of Insights for ArcGIS comes from its ability to integrate a variety of data sources for your analysis, even if that data does not naturally have geographic context. Insights integrates and allows analysis on the following types of data
- ArcGIS feature data
- Geodatabases
- Enterprise data warehouses
- Big data
- Real-time streams
- Excel spreadsheets
Insights also leverages Esri’s vast ecosystem of data, including the curated and authoritative Living Atlas of the World. By including a wider variety of information in analysis, users can now find answers to questions that they previously couldn’t even think to ask.
Optimized for Performance From the Source
To ensure fast performance and a low-latency user experience, Insights for ArcGIS selects the most optimal way to query and work with your data. For certain types of data, it executes queries at the source. This means that you don’t have to wait for new derivative data to be created with each query or analysis. With other data sources, like big data, it can leverage the existing power of your analytics engines. All of this is orchestrated by Insights behind the scenes.
Interactive Analysis and Visual Data Exploration
Insights for ArcGIS also introduces a new paradigm for data exploration that is visually-oriented, intuitive and responsive. Users can drag-and-drop fields to introduce new data into their analysis. Maps, charts and tables that represent data are housed in cards, which can be linked to each other. Any action in one card can be visually reflected in the others. For example, if a data point is clicked in a chart, it can filter and update the view in other cards.
Since it is integrated with the ArcGIS platform, Insights provides many of the powerful analysis tools that users are familiar with (e.g., summarization, proximity, statistical and pattern analysis, and more). For visualization, users have access to thematic maps and the complete gamut of smart mapping capabilities.

Coming Soon
Insights will be released later this year. Early Adopter and Beta programs will begin in Q2 of this year. You can apply to participate in the Beta, and learn more about Insights today at www.esri.com/insights.