A vast amount of data is created every day from sensors and devices: GPS devices on vehicles, objects, and people; sensors monitoring the environment; live video feeds; speed sensors in roadways; social media feeds. What it means is that we have an emerging source of valuable data. It’s called “real-time” data. Only recently has the technology emerged to enable this real-time data to be incorporated into GIS applications.
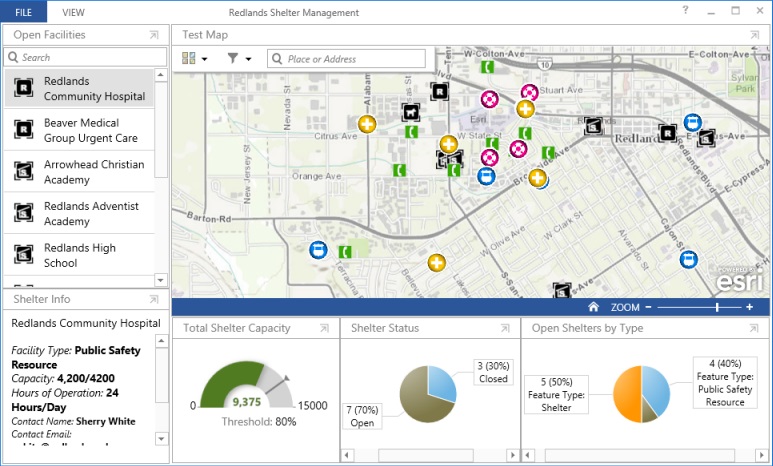
The real-time GIS capabilities of the ArcGIS platform have transformed how information is utilized during any given situation. Real-time dashboards provide actionable views into the daily operations of organizations, empowering decision makers and stakeholders with the latest information they need to drive current and future ideas and strategies.
Dashboards answer questions like:
- What’s happening right now?
- Where is it happening?
- Who is affected?
- What assets are available?
- Where are my people?
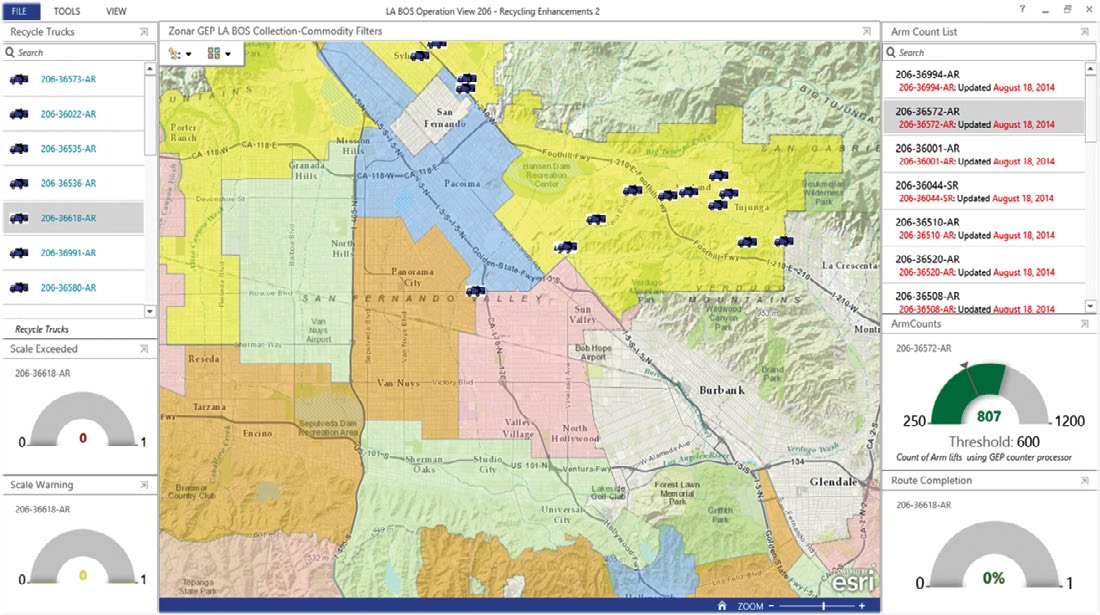
- Local governments use real-time information to manage operations such as tracking and monitoring snowplows and trash trucks.
- Utilities monitor public services including water, wastewater, and electricity for consumers.
- Transportation departments track buses and trains and monitor traffic flows, road conditions, and incidents.
- Airport authorities and aviation agencies track and monitor air traffic worldwide.
- Oil and gas companies track and monitor equipment in the field, tanker cars, and field crews. Law enforcement agencies monitor crime as it happens, as well as incoming 911 calls.
- So they can issue early warnings and reports, federal agencies like the Federal Emergency Management Agency (FEMA), the US Geological Survey (USGS), the National Oceanographic and Atmospheric Administration (NOAA), and the Environmental Protection Agency (EPA) gather vast amounts of information about the environment. They monitor weather, air and water quality, floods, earthquakes, and wildfires.
- Companies use real-time social media feeds like Twitter to gauge feedback and monitor social sentiment about particular items of interest.
- Individuals use smartphones, smartwatches, smart sensors, radio-frequency identifications (RFIDs), beacons, fitness bands, etc., to capture and visualize information about everything we do (often referred to as the Internet of Things).
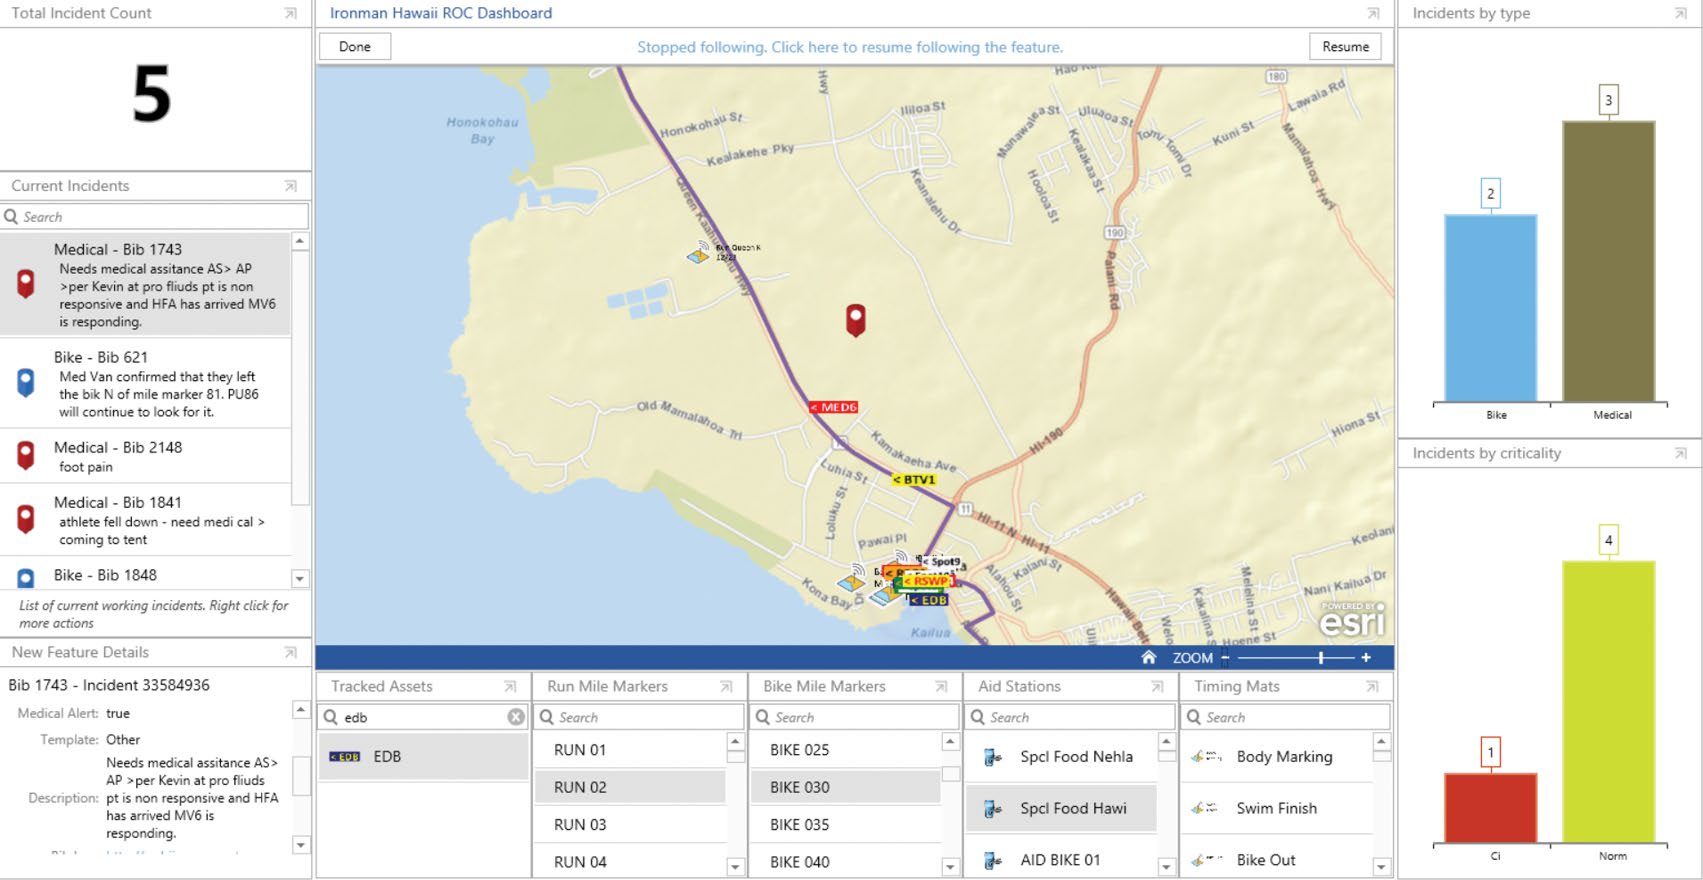
- Emergency management agencies monitor public safety during large events, such as marathons and the Olympics.
Learn ArcGIS Lesson: Explore then recreate a dashboard
In an emergency, a coordinated effort saves time, which can save lives.
For this lesson, assume you are a GIS coordinator at an emergency response agency that is responsible for managing local emergency vehicles for the City of Redlands, California. You have at your disposal a lot of information and data sources to track. You need a way to bring all of this information together into a dashboard that will enable police and fire supervisors to know where all their assets are in relation to actual incidents happening on the streets.
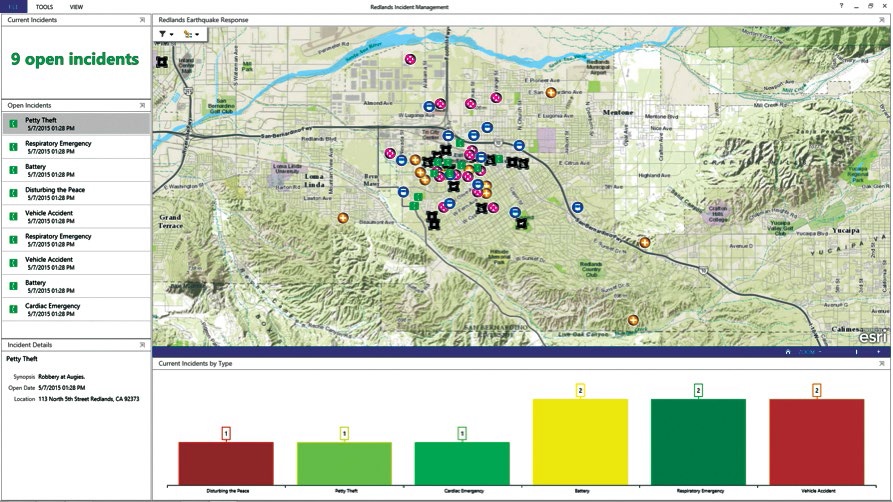
In this lesson, you explore an existing real-time dashboard that has been configured around this response effort. Then you will create an instance of the dashboard. (The scenario and the data you work with in this lesson are simulated and not based on actual events.)
In this lesson, you’ll build skills in these areas:
- Create a web map
- Create a real-time dashboard
- Work with real-time data
- Customize an operations view
What you need:
- ArcGIS organizational account
- Operations Dashboard (for Windows only)
—–
This post is excerpted from the new book, The ArcGIS Book: 10 Big Ideas about Applying Geography to Your World. The twin goals of this book are to open your eyes to what is now possible with Web GIS, and then spur you into action by putting the technology and deep data resources in your hands. The book is available through Amazon.com and other booksellers, and is also available at www.TheArcGISBook.com for free.