Distribution utilities can never guarantee uninterrupted power. A heavy storm, a fallen branch, a car accident or even scheduled maintenance can easily down electric lines. While disruptions are inevitable, what sets an agile and leading utility apart from the rest is its ability to quickly restore service and minimize outages, improving overall reliability.
One of the keys to rapid and effective outage response is efficient internal communication. How does information flow within the organization? Do staff, managers and directors have an up-to-the-minute understanding of how systems are performing, and what is being done to optimize that performance?
Access to real-time, accurate information about the current state of the utility’s network is critical to making intelligent decisions, especially during outages. Many utilities may already have the geographic information system (GIS) technology in place with a long-term vision of enabling this, but often, that goal remains unrealized.
GIS is typically used to map a utility’s assets and create a spatially accurate digital representation of the transmission and distribution network. Significant advancements in GIS, as well as cloud and mobile technologies, now make it possible for utilities to leverage those investments in cloud-based operations dashboards—accessible from anywhere on any device. GIS can be used to ‘mash up’ information from many systems into a single portal that provides decision-makers across the organization with a holistic view of current system health at a glance.
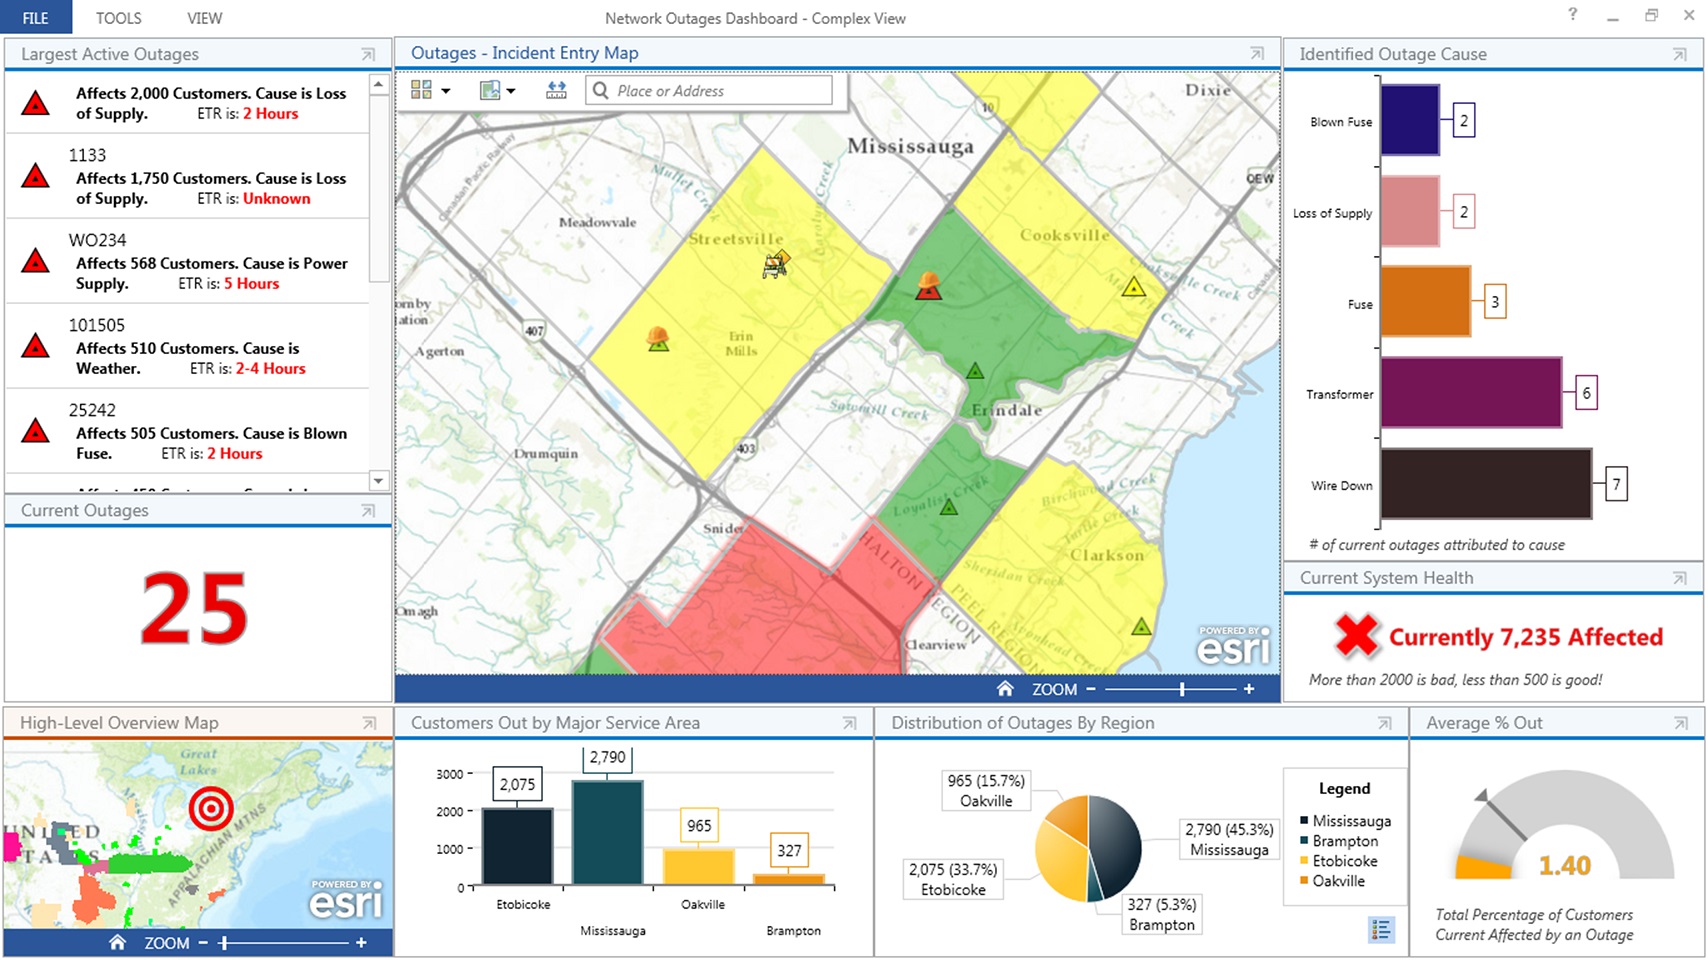
- What is the current operational status of the network?
- What incidents or outages are occurring and where, and are there any trends?
- What percentage of the system is down?
- How many customers are affected at regional and sub-regional levels?
- Are there any environmental events present that might impact operations and restoration efforts?
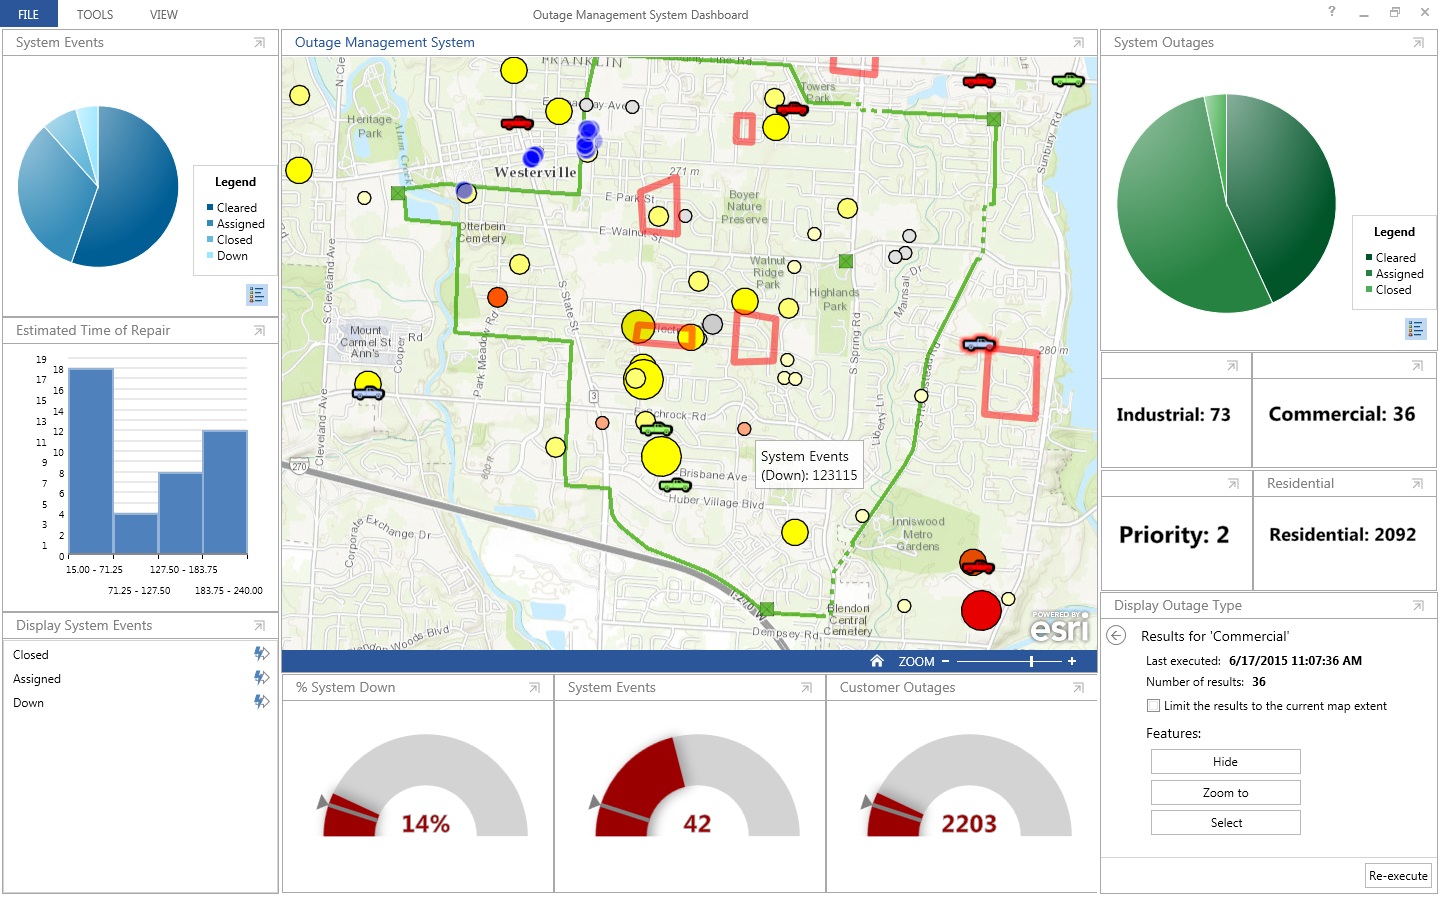
The dashboard provides intelligent decision support by incorporating various datasets for rapid in-depth analyses. Because of the geographic nature of distribution utilities, the dashboard must consist of an interactive map with real-time information from numerous data sources including the utility’s operational systems (i.e. outage management system (OMS), advanced metering infrastructure (AMI), etc.), business systems (i.e. financial and customer information systems) and news and weather feeds from external sources. It must also display charts, gauges and histograms that provide valuable statistical context for outages.
Delivering the right information to the right person at the right time
Often, too little or too much information slows down analysis and decision-making. Operations dashboards must be configurable to display relevant datasets based on an individual’s role in the utility. For example, a dashboard for emergency operations centre staff might include a live map that plots locations of outages, customers and assets; automated vehicle location data to enable real-time tracking of field crews; and live weather feeds that enable dispatchers to monitor severe weather events that could impact restoration efforts and allow them to redirect crews accordingly.
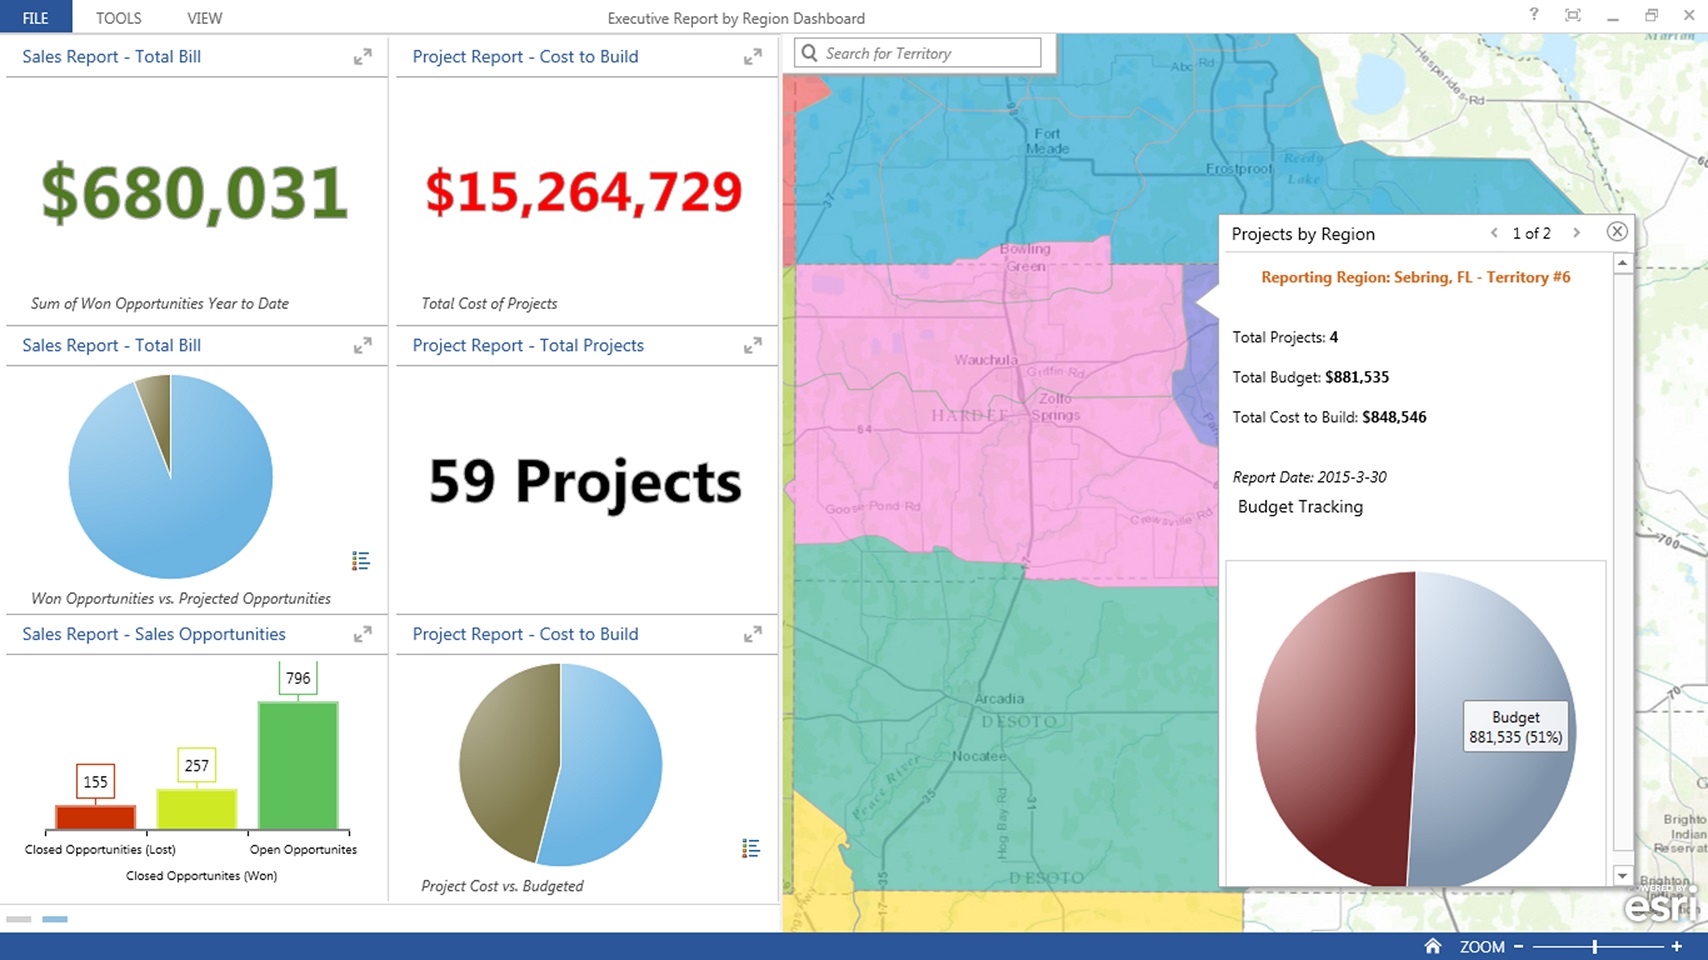
Further, the dashboard can be built into an overall framework that integrates information from the utility’s OMS, AMI, SCADA and other real-time systems; displays the data through the operations dashboard; and sends outage notifications to customers via social media, e-mail and text messaging.
Ultimately, GIS enables utilities to be proactive in communicating and managing outages, improving their ability to deliver exceptional customer service.
—
Esri Canada provides enterprise geographic information system (GIS) solutions that empower organizations to make timely, informed decisions by leveraging the power of geography. Utility professionals worldwide use Esri technology to manage assets, offer higher levels of customer service and operate more efficiently. GIS provides the underlying network model for the smart grid and also plays a vital role in facilitating mobile operations, planning and designing networks, and enhancing operational awareness. GIS enables utilities to document where assets are located, determine how they are connected or configured and how they can best meet the needs of customers, stakeholders, employees and society. For more information, visit esri.ca.
—–
Originally published with Electricity Distributors Association in The Distributor Magazine