Story Maps are fun, easy, and informative. Their popularity is documented by the many interesting examples you will find at the Story Maps Gallery. An enduring favorite of mine is not the most sophisticated, or provocative, or one that required GIS tradecraft to produce, but rather it’s one that’s elegant in its simplicity, in both implementation and subject matter. It’s one about, of all things, cinder blocks – the Blockspotting Map Tour.
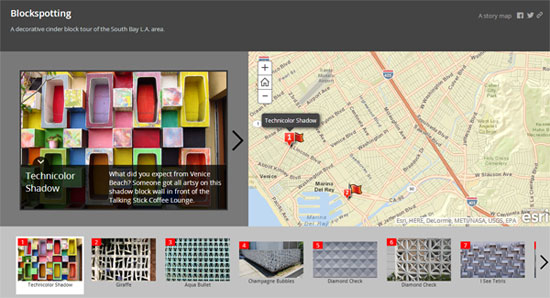
Who would have thought that cinder blocks could be so interesting? I sure didn’t until I saw this tour. My reaction underscores one of the many reasons why Story Maps are useful for not only fun topics, travelogues, or news stories – they convey a topic in an easy to understand and engaging manner. Besides “fun” topics, Story Maps can be compelling vehicles for important “bread and butter” apps that GIS organizations may need to create, either as internal information tools or to serve public information needs. Here’s a few examples.
San Bernardino County Capital Improvement Projects
County of San Bernardino Department of Public Works
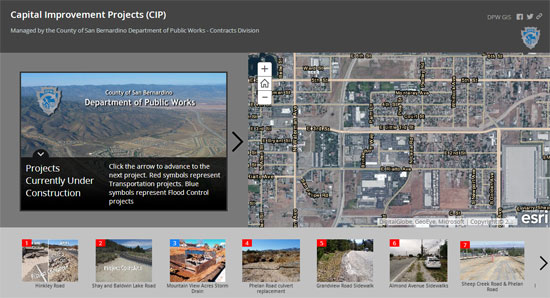 What’s a more “bread and butter” activity than public communications? This is especially true when communicating about how money is being spent. This simple map tour presents photos and locations of 23 projects throughout the County.
IDFG Wildlife Management Areas
Idaho Department of Fish and Game
 Another public information example, this one stands out because of the rich pop-ups it has been configured with, which include the ability for viewers to download PDF maps. This example uses the Story Map Playlist app.
Sea Level Rise Inundation
State of Delaware
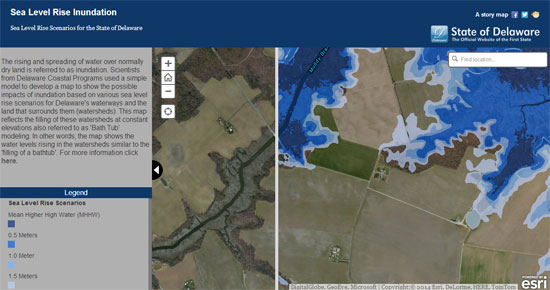 Using the Story Maps Swipe app this example shows the results of a sea level inundation model based on several rise scenarios. Story Maps provides an effective vehicle for communicating GIS analysis results to both decision makers as well as the public. The Swipe app effectively shows the results of the analysis, and is easy enough for anyone to use to explore the analysis results.
Climate Change in Europe: Outlook for European Cities
European Environment Agency (EEA)
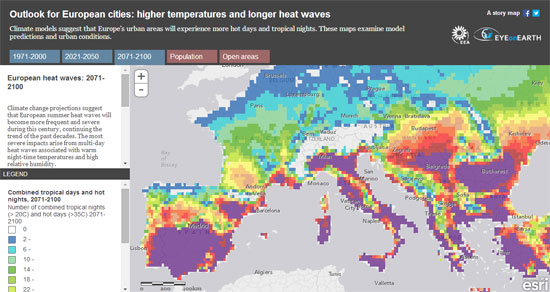
Climate models are complex, but even complex models can be presented effectively using Story Maps. This example uses the Tabbed Viewer app (also known as the Text and Legend app). By presenting several maps using tabs, various scenarios are presented and the user can explore each to learn more.
Carver County Minnesota Water Quality
Carver County Planning and Water Management
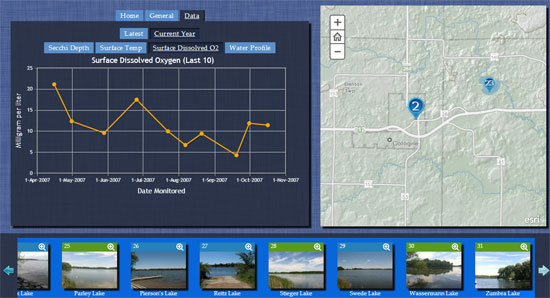 This customized map tour presents information about water quality in over 30 Carver County lakes. It not only offers photos of each lake, but more importantly is a presentation framework for details of lake quality measurements, such as secchi depth measurements, temperature, dissolved oxygen levels, and more. What’s interesting about this example is how it integrates different kinds of data and incorporates graphs and charts to show measurements over time, all within the map tour context.
What are your “bread and butter” stories?
Let us know what your bread and butter stories are, and how you’ve used Story Maps to unlock your GIS for a broader audience.
For more information visit the Story Map web site to learn more about how you can inform and inspire your audience.