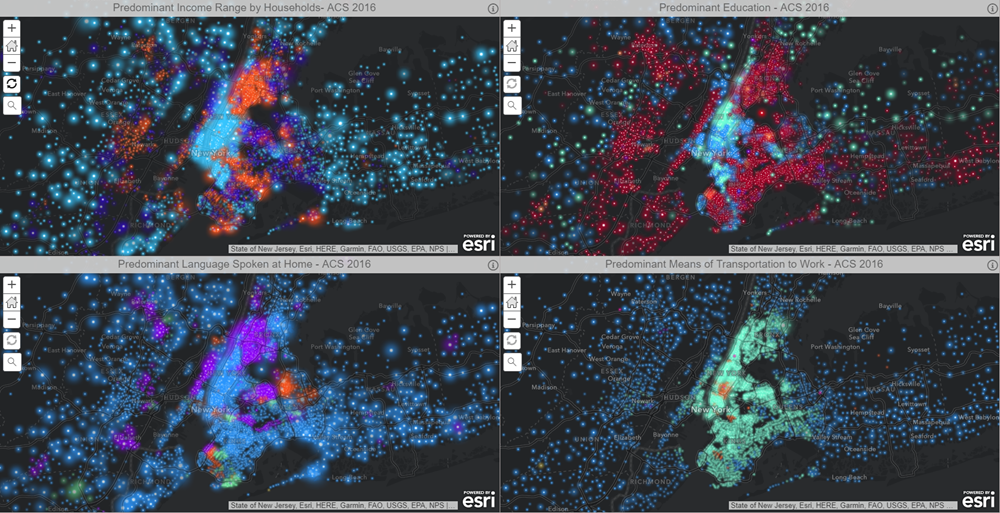
The ArcGIS Living Atlas of the World has a new set of maps that make US Census data really shine (pun intended). Using the new Firefly Cartography style, these maps highlight distinct patterns about how the population and households are distributed throughout the United States. They cover a range of topics such as income, educational attainment, language spoken at home, and transportation to work.
These maps use the 2012-2016 American Community Survey (ACS) data offered by the US Census, which was released in December 2017. Each web map contains the data for both counties and census tracts to help tell a regional and local story about the data. At a nationwide scale, you’ll see the county pattern, and as you zoom in, the census tracts will appear. The maps use point centroids instead of polygons to avoid drawing extra attention to larger counties and tracts simply because they take up a large amount of area.
To learn more about these maps, let’s explore the Predominant Income map.
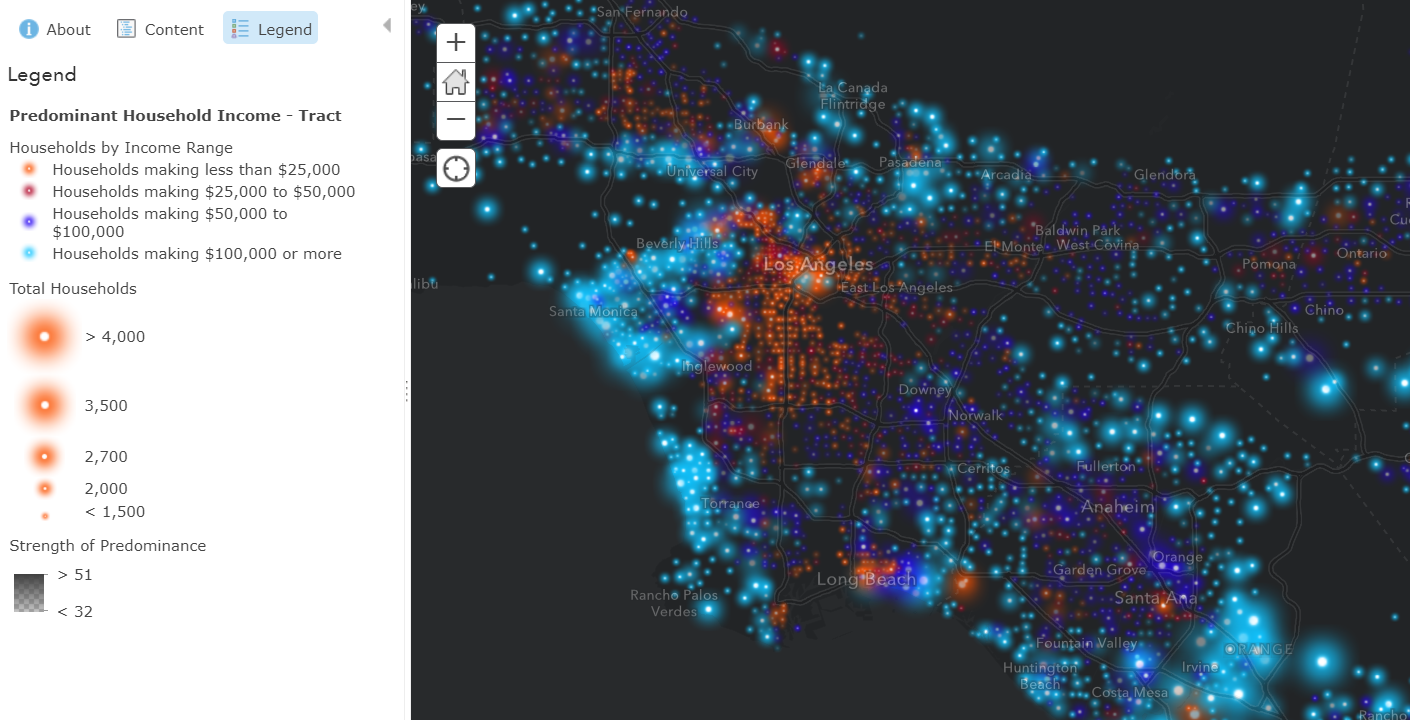
This map groups households into four income ranges and shows the group with the highest count of households. This mapping technique is known as predominance, and can easily be done in ArcGIS Online within the Change Style settings. This technique highlights the predominant income range, and the symbol’s brightness depends on how predominant the range is over the other categories (strength of predominance). This map helps us understand the distribution of income, and has interesting patterns of wealth and poverty, especially in large cities like New York City, Los Angeles, and Chicago.
The size of each point represents the quantity of households in that area. Within each of these firefly demographic maps, the size of the symbols represent the population sampled by the ACS. So in the Predominant Education map, the size of the symbols shows the count of population aged 25+ because the map represents the predominant education level of the population 25 and up.
To learn more about an area, click on the map to reveal a popup which showcases the overall pattern of the data. In the income map, the popup tells you the predominant income range and also shows you a chart of the categories being compared.
There are many ways these maps can be used. The only limit is your imagination! The web maps are ready to use, and can be added directly into your mapping applications. The layers are also included in the Living Atlas as hosted feature layers so that they can be added into your own maps and analysis. You can even make new maps using the data by changing the map style and saving the changes as your own web map. Within each layer, there are other attributes related to the map topic. Since this data comes from the ACS, the margins of error are also included in the data.
Happy mapping!


Article Discussion: