Drawing your audience into the story you’re telling
Maps are interactive, rewarding experiences, and not just pretty pictures. The most valuable maps are information products that are visually interesting from the first time you see them. Yet they reward you with additional information as you explore and interact with the map. When you touch the map, it responds by giving you details about the things you touch—touch a store and it tells you this year’s sales to date with a chart of the previous three years’ sales.
Great maps don’t just happen automatically, though. You have to put a little bit of yourself into the effort, just like a great resume, which starts out as a template but requires your information—your data—as well as your interpretation to make it really sing. The data you are mapping won’t tell its story without your help. Once you see the patterns emerging in the map, you can start emphasizing what’s important, and de-emphasize everything else.
Try to always make “beautiful” maps. By that, we mean effective ones that are clear on first opening but that also engage users of all levels to drill in, explore, interrogate, and learn.
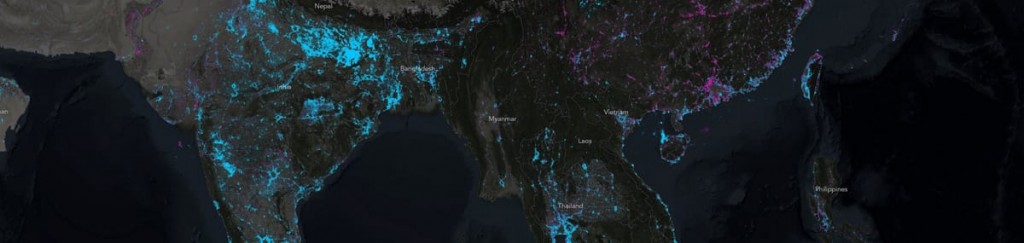
This story map looks at where night lights have turned on (blue) or dropped out (magenta) globally. Southeast Asia and the Indian subcontinent are shown here.
Start with the final result you have in mind and work backward. To paraphrase Roger Tomlinson, one of the fathers of GIS in the 1960s, you’ve got to know what you want to get out of a GIS to know what to put into it. Clicking aimlessly leads to no clear resolution. Have a clear idea of the story you want to tell about your data. Then get some test data and go for it.
> Make a Better Map: How to map counts and percents together
ArcGIS Pro: The Cartographer’s Workhorse
ArcGIS Pro provides capabilities that enable serious mapmakers to create truly excellent maps, including support for highly sophisticated mapping workflows employed by professional cartographers. It includes tools for rich data compilation, for importing data from a multitude of publication formats, and for integrating this data with your own data to create consistent, accurate, and beautiful cartographic products for both printed and online maps. ArcGIS Pro is the workhorse application for serious cartographic production in both 2D and 3D and is used daily by hundreds of thousands of GIS users worldwide. This modern application builds on the tradition of great mapping with such enhancements as advanced 3D scenes.
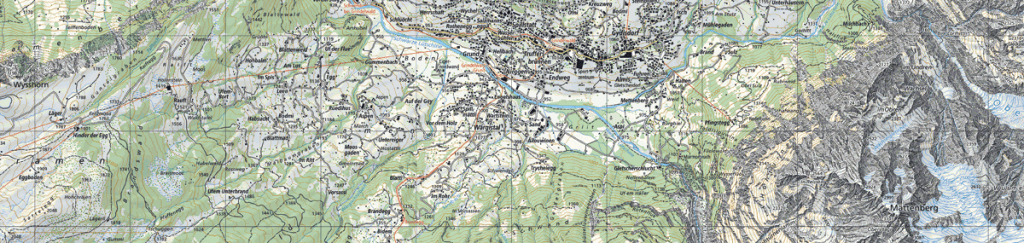
Swisstopo is the official name of the Swiss Federal Office of Topography, Switzerland’s national mapping agency. With all the mountains in Switzerland, it should be no surprise that it developed many classic cartographic techniques, including the Swiss Hillshade.
The swisstopo map seen above, with its characteristic drawing and text style evolved by generations of Swiss cartographers over the past century, is widely considered the benchmark for 3D topographical mapping on paper. Today the agency uses tools like ArcGIS Pro to achieve the same results with computers.
Maps into the Third and Fourth Dimensions
While great cartography obviously predates the advent of computers, the digital era has yielded incredible fruit when it comes to mapping in the third (vertical) and fourth (temporal) dimensions. ArcGIS Pro provides tools that allow modern spatial storytellers to extend their maps into 3D and 4D (aka time).
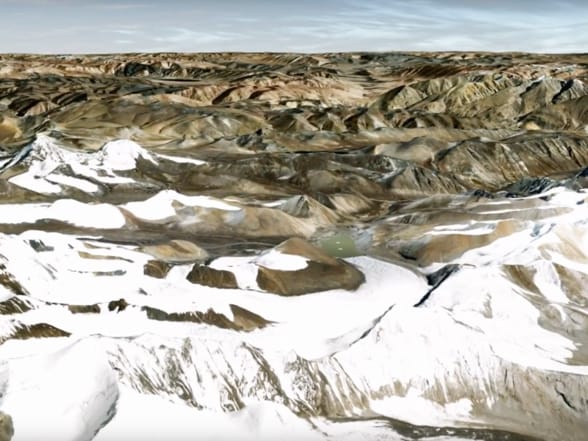
Mapping a common climbing route from Mount Everest base camp to the summit at 8,848 meters.
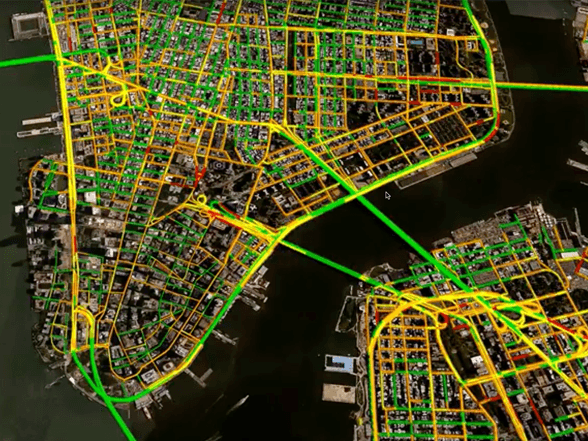
Traffic patterns come alive using the animation tools in ArcGIS Pro.
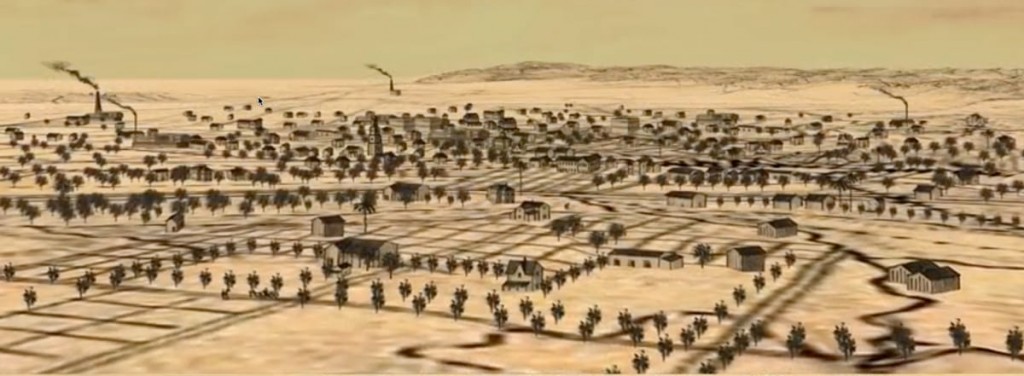
Inspired by E.S. Glover’s famous illustration, this 3D animation featuring the Los Angeles Basin in the late 1800s was created entirely in ArcGIS Pro.
Get Inspired
Get inspired and learn current mapping techniques using curated selections of exemplary cartography from the Maps We Love.
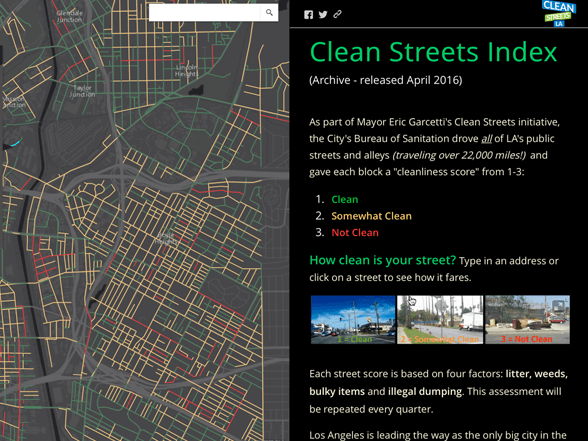
Street cleanliness in Los Angeles
What makes a good map? How can you engage people with a map? How do you make a map that offers unexpected insights and captivating appeal? We have been working on something at Esri that we hope will answer these questions: Maps We Love.
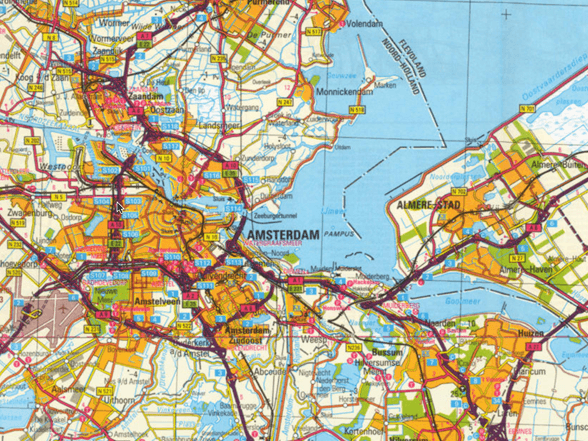
Two hundred years of Dutch cadastre
Maps We Love is an ongoing project where you will see the best of what’s possible with ArcGIS. This is where you come for the inspiration, ideas, and information you need to turn your data into brilliant maps. We give you a behind-the-scenes look at important steps, plus resources (lots of links) so you can dig deeper into these topics. Maps We Love is designed to demystify mapmaking, to give you the confidence and assurance that you can make beautiful, effective maps.
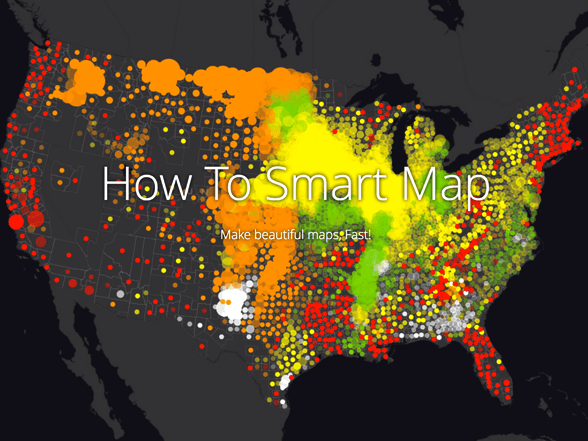
This guide, presented as a story map, explains what smart mapping is, and how to get started using this special capability.
Learn ArcGIS Lesson: Cartographic Design with ArcGIS Pro
In this lesson you’ll use the US Department of Defense’s recently released Theater History of Operations data to create an 11” x 17” wall map encompassing all bombing and ground attack missions carried out by the United States from 1966 to 1974 during the Vietnam War.
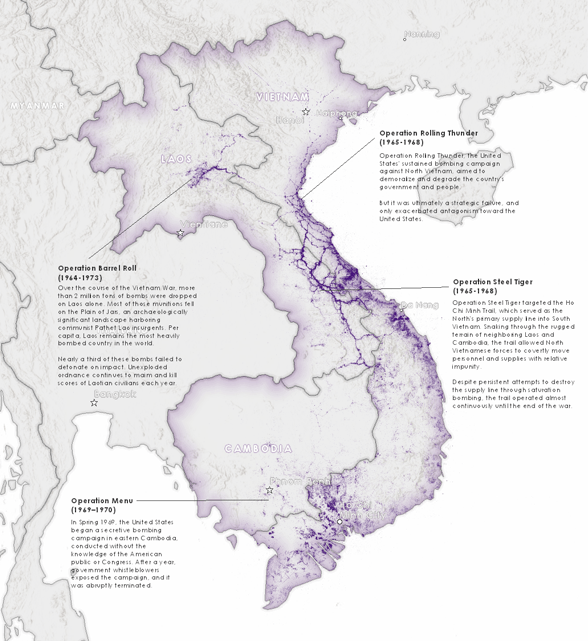
You’ll begin by downloading detailed country outlines from the Living Atlas. With over 3.1 million missions in the dataset, the challenge is to create a data visualization that is more of a macro view. Each mission is represented by a single, nearly transparent point, so that isolated missions are hardly visible, while areas of intensive saturation bombing are nearly opaque. Finally, you’ll add a column chart of total missions by month and additional map elements including annotations, a scale bar, and title to complete the final product.
—–
This post is excerpted from The ArcGIS Book, Second Edition: 10 Big Ideas about Applying The Science of Where, by Christian Harder and Clint Brown. The twin goals of this book are to open your eyes to what is now possible with Web GIS, and then spur you into action by putting the technology and deep data resources in your hands. The book is available through Amazon.com and other booksellers, and is also available at TheArcGISBook.com for free.

Commenting is not enabled for this article.