Today marks a significant milestone in the history of Insights for ArcGIS, the new web-based, data analytics workbench that allows you to jumpstart your spatial analytics. Not only is this the 1st year anniversary since Insights released, we’re happy to announce the much-anticipated availability of Insights on the ArcGIS Online platform!
Over the past year, Insights for ArcGIS has been on a development fast track with seven significant updates averaging an 8-week release cycle packed with new features, capabilities, and enhancements that make performing data analytics in both a spatial and non-spatial context a fast, visual, and intuitive experience.
For those new to Insights, below is a summary of some of the great features you can benefit from to save time and find quick answers. Already familiar with Insights for ArcGIS in ArcGIS Enterprise? The Online version of Insights includes all of the functionality of the ArcGIS Enterprise version, with the exception of features that are specific to ArcGIS Enterprise, such as ArcGIS GeoAnalytics Server and direct database connections. Here is an overview of what’s new in the online release.
Drag and drop interface
Insights uses a drag and drop interface that makes analysis and content creation quick. You can drag and drop a dataset to create a map or perform a spatial aggregation or filter. You can also expand a dataset and select fields to style a map or create charts and tables.
These features are great when you want to quickly start an analysis task. Insights for ArcGIS exposes the most commonly used spatial analysis tools so you can explore your data and focus your analysis.
Want to learn more about using the drag and drop interface? Check out the following resources:
Interactive cards
In Insights, all of your content is created on cards, including maps, charts, and tables. Cards that were created using the same dataset are linked, meaning that interactions you make with one card will be reflected on the others. Cross filters are a new feature that allow you to filter cards using a selection on another card. Interactivity helps you to quickly identify relationships, patterns, and trends in your data.
Use the following resources to learn more about interactive cards:
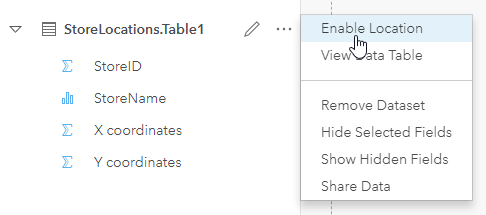
Enable location
Insights is compatible with spatial data, such as feature layers, and non-spatial data, such as Excel tables. An Excel or CSV table can be used to create charts and tables, or it can quickly be turned into a spatial table by enabling location with x, y coordinates, addresses (geocoding), or geography (for example, county). You can even enable location on a spatial dataset, giving your data more than one spatial field.
For more information about enabling location, see the following:
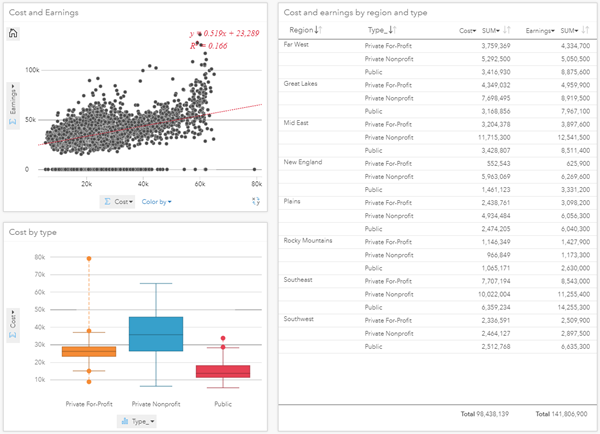
Spatial and Non-spatial visualizations
In Insights, non-spatial visualizations, like charts and tables, are an important part of your analysis. You can create 14 types of charts to pair with your maps and summarize your data in tables. Charts and tables help you with aspects of your analysis that are not spatial in nature. Insights allows you to act on any question that comes your way by bringing together all data and visualizations relevant to your analysis.
Learn more about data visualizations using these resources:
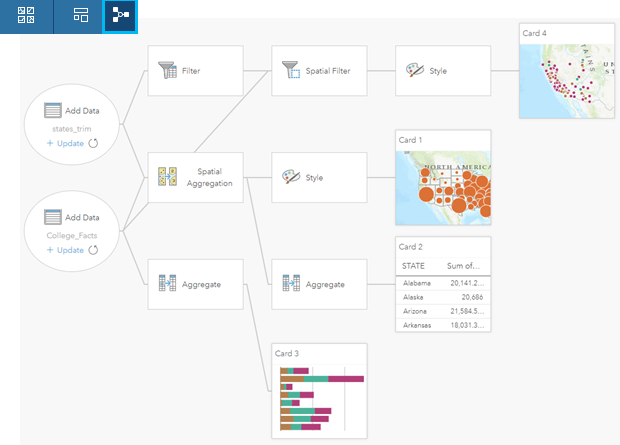
Analysis view
As you perform analysis in Insights, your steps are automatically saved and the model can be viewed in the Analysis view. The Analysis view enables you to focus on exploring and analyzing your data by allowing you to bypass the process of manually tracking your analysis. The steps can also be shared as a model and rerun using updated or different datasets.
Here are some resources to learn more about models:
Resources
Ready to jumpstart your spatial analytics? Try Insights for ArcGIS today with ArcGIS Online.


Commenting is not enabled for this article.