The next update of the Community Analyst is planned for early December 2017. This update will enable you to add users to projects, insert maps in custom reports, experience a new interactive comparison reports, leverage major enhancements to infographics and suitability analysis, and much more.
Here are the key highlights of what’s coming:
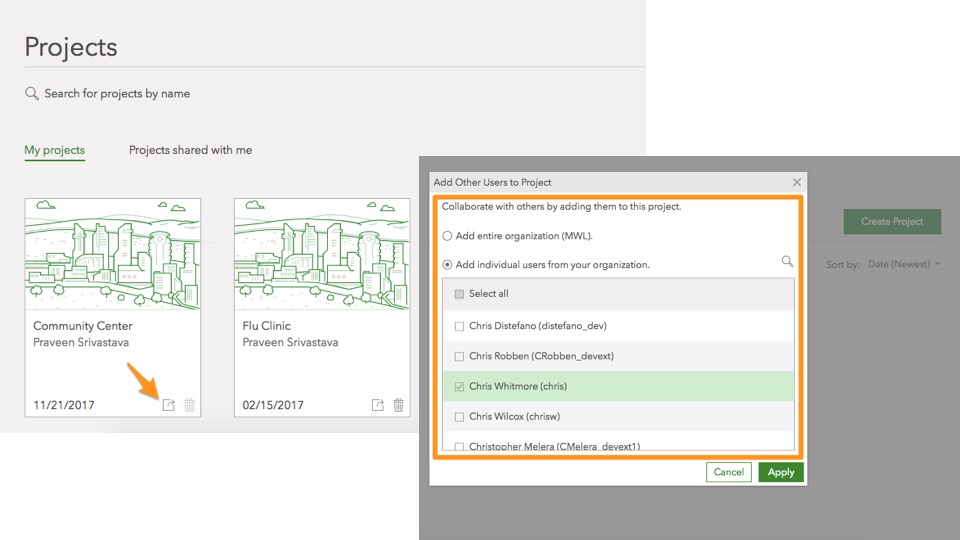
Share your work with other users in a much simpler way. Add individual users or the whole organization to your projects and collaborate more easily. For example, create a layer of all community center locations in your project. Users added to your project can simply access and use that layer and don’t need to recreate it.
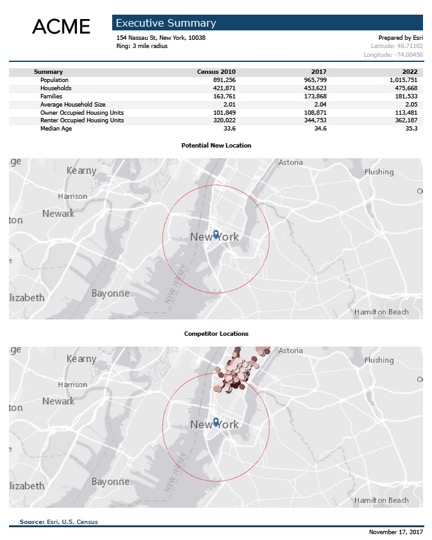
Insert Maps in Custom Reports
When customizing a report, you will have the ability to insert a map. You can show the location of your site or add any other web map such as a map of all existing community center locations.
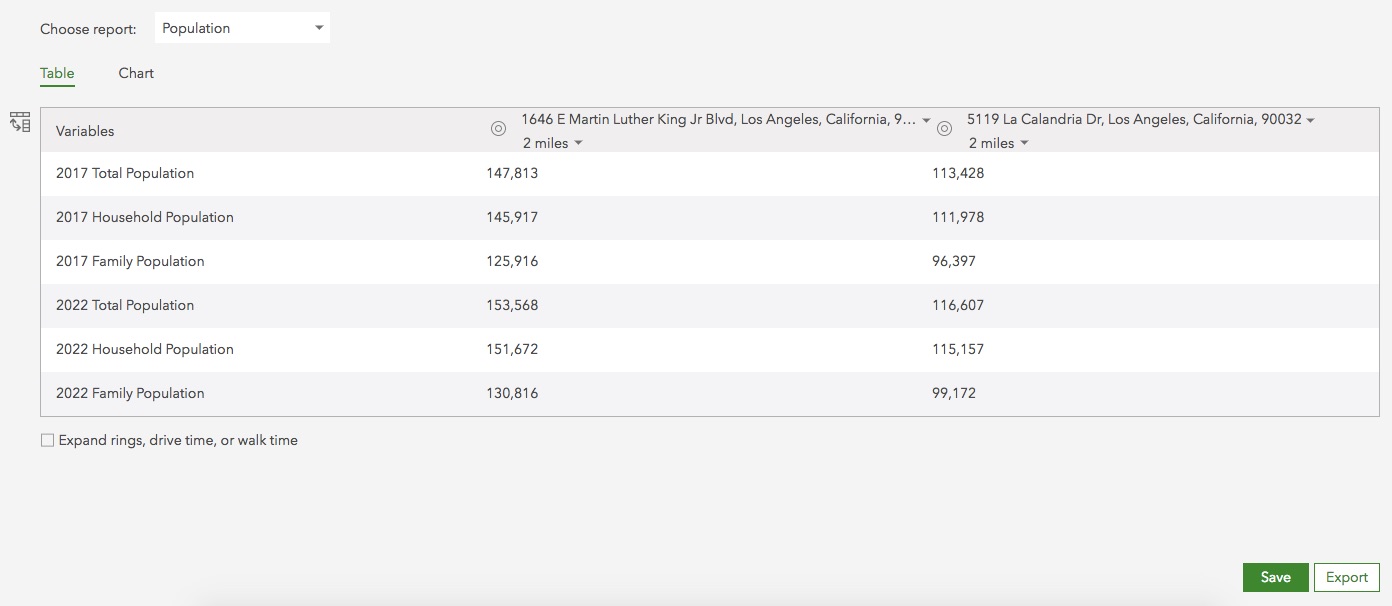
Compare Information for Multiple Sites Interactively
Introducing a new way of doing site comparisons. Interactively build comparison and benchmark table and charts. Include sites, neighboring geographies, data variables, and statistical values (i.e. average and median). Configure them by dragging and dropping rows and columns and quickly create the desired comparison.
Run Reports and Infographics More Efficiently
Easily run reports and infographics for sites from multiple projects or on the map. Running infographics will be added to the Reports tab so you run infographics without going on the Maps tab.

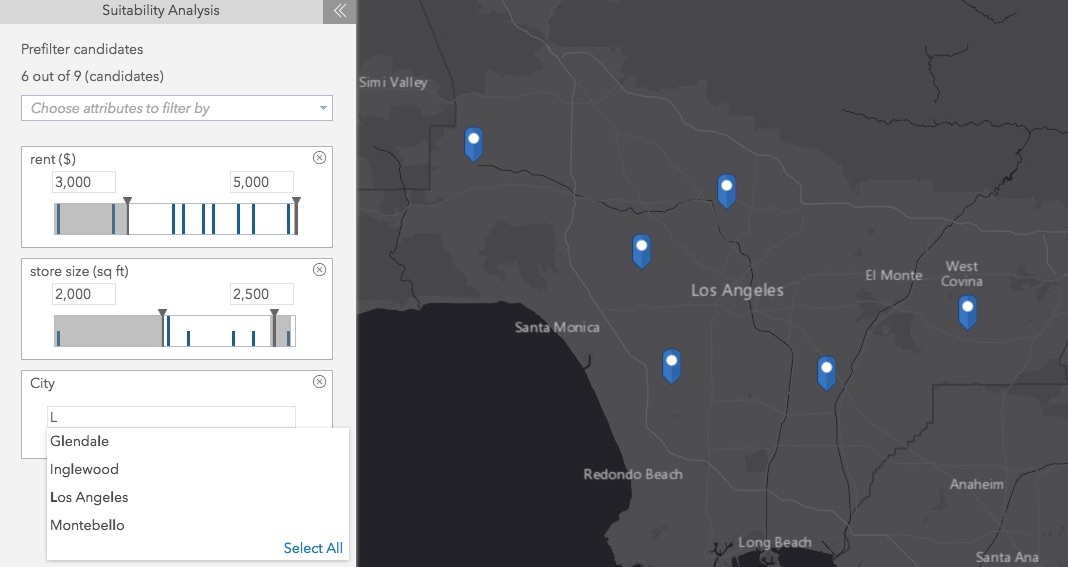
Prefilter Suitability Analysis Candidate Locations
Filter out locations that don’t meet specific criteria before running suitability analysis. For example, let’s say you have a layer of potential building locations that you are evaluating. You want to eliminate buildings that have really high rent or that are in wrong zoning or that are not two-story buildings. The prefiltering option will help prepare the right candidate locations and then run suitability analysis only on those.
Enhancements for the Infographics Building Experience
Some highlights below:
- Use a new Executive Summary infographics template
- Use picture charts to make more visually appealing charts
- Align elements in infographic panels more efficiently
- Use site attributes (e.g. building area, number of parking spaces) in infographics
- Add free floating background images and text
- And many more improvements..
Use Validation on Location Attributes
Want to apply specific constraints on the location attribute values? For example, prospective community center locations must have parking spaces over 100 or the building condition should be chosen from a drop down with options as – good, average, poor.
This will be possible to set up while creating project. The app will honor the attribute validations and show informative messages when the entered numerical value is out of the defined range or the drop down of options for text fields.

Data Updates
- Nexiga Data for Germany is planned to be updated to 2017 vintage
- MBR for New Zealand, South Africa, and Puerto Rico is planned to be updated to 2016 vintage
Please note that all planned updates are subject to change. Stay tuned for more information on the new features and enhancements after the release.

Commenting is not enabled for this article.