By Aileen Buckley, PhD, Esri Research Cartographer
Are you trying to get up to speed with temporal data in ArcGIS? In this set of lessons, you’ll learn how to manage, analyze, and map temporal data in ArcGIS for Desktop. You’ll use techniques such as time-enabled mapping, spatial analysis using a Model Builder model with an iterator, and spatial analysis using geoprocessing tools with a Case field. To learn these techniques, you’ll perform a case study about Dreissena polymorpha, commonly known as the zebra mussel. In just over two hours, you’ll be ready to analyze and map your own temporal data.
Here is a list of the lessons:
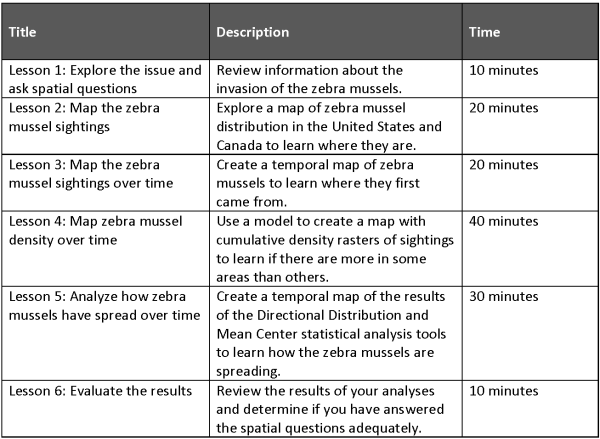
Figure 1. Lessons to learn about getting started with temporal data in ArcGIS.
Here are the links to:
- The documentation, with step-by step instructions for working with the sample data.
- The sample data, which includes a map document, file geodatabase, toolbox, and style.
The sample data also includes a backup folder with the results of the completed lessons so you can check your work or recover the correct results.
Get started now! As they say—time is of the essence!

Article Discussion: