Recording times and dates can be invaluable during the data collection phase of a project. Date data help us answer questions like, “When did this incident occur?”, “How long did it take to accomplish task A?”, or “What assets are due for inspection?”
Questions of when can often be answered by simply displaying the date value. Other times you may need to know how long or how old. That’s where Arcade comes in handy. Arcade is an expression language used to dynamically calculate values for rendering, labeling, and popups with attribute values. Arcade executes on the client, which means you don’t have to create new fields and use the field calculator to generate new values from your existing data. You can quickly create and explore new data values on the fly.
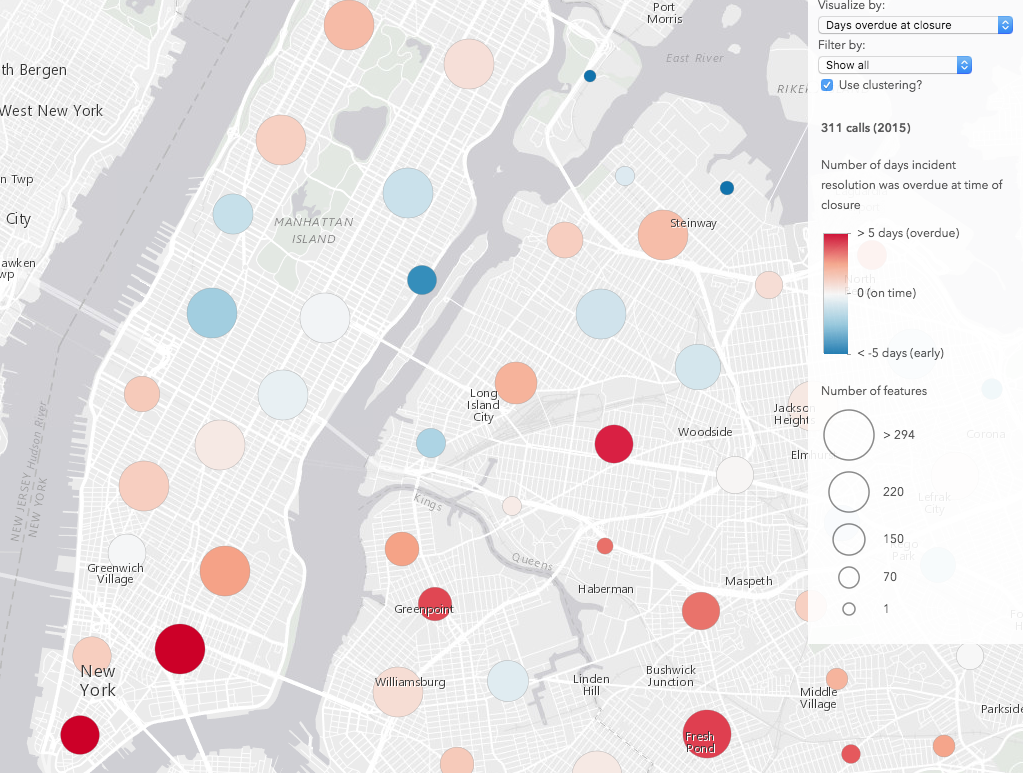
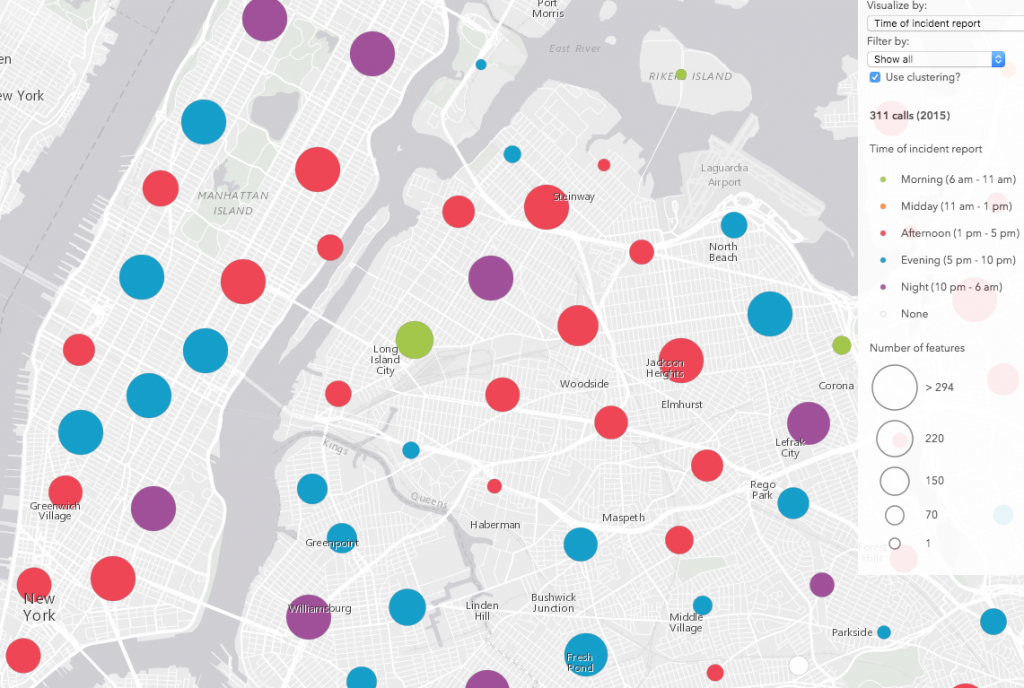
Check out this app, where I used several Arcade expressions to answer time-related questions about 311 data in New York City. These questions include:
- At what time of day was the incident reported (morning, afternoon, evening)?
- How long was the incident open at the time of its closure?
- Was the incident overdue at the time of closure? If so, by how long?
Date functions in Arcade
Arcade has several out-of-the-box date functions that simplify the process for answering these questions. Functions such as DateAdd(), DateDiff(), toUTC(), Hour(), Weekday(), and others are available for your convenience when exploring and displaying time data. These functions can be used to quickly make several unique time-based visualizations that show various patterns throughout the city.
In the 311 app, the following expressions help us answer the questions listed above. Different patterns emerge depending on filters to the time of day, and the type of incident.
Was the incident overdue at the time of closure? If so, by how long?
var closed = $feature.Closed_Date;
var due = $feature.Due_Date;
var closureDueDiff = DateDiff(closed, due, "days");
IIF(IsEmpty(closed) || IsEmpty(due), 0, closureDueDiff);
How long was the incident open at the time of its closure?
var closed = $feature.Closed_Date;
var created = $feature.Created_Date;
IIF(IsEmpty(closed) || IsEmpty(created), 0, DateDiff(closed, created, "days"));

At what time of day was the incident reported (morning, afternoon, evening)?
var t = Hour($feature.Created_Date);
When(
  t >= 22 || t < 6, "Night",
  t >= 6 && t < 11, "Morning",
  t >= 11 && t < 13, "Midday",
  t >= 13 && t < 17, "Afternoon",
  t >= 17 && t < 22, "Evening",
"Invalid date" );

Easy, right? Not so fast…
Dates are confusing
Date and time data are notoriously difficult to work with. If date calculations haven’t caused you to bang your head against the wall or pull your hair out with frustration, then you probably haven’t spent enough time working with them.
A lot of the confusion stems from time zone offsets and locations that observe Daylight Savings Time (and those that don’t). Those concepts are further compounded when you consider that the client (browser) interprets the date in the time zone in which it is located regardless of where the data is located. To further add to the confusion, dates can either be published in the time zone in which they were collected, or in UTC time. Is your head spinning yet?
It is important to keep these considerations in mind when attempting to visualize time of day for the location of each feature. For example, see the expression below, which was referenced earlier.
var t = Hour($feature.Created_Date);
When(
  t >= 22 || t < 6, "Night",
  t >= 6 && t < 11, "Morning",
  t >= 11 && t < 13, "Midday",
  t >= 13 && t < 17, "Afternoon",
  t >= 17 && t < 22, "Evening",
"Invalid date" );
Publishing times and dates
Before proceeding to accept this as a valid expression, we need to understand how the data was published (or should be published). Do the recorded times represent the local time where the data was collected? Or do they represent UTC time? Are the data points located in one time zone, or do they span multiple time zones? If the timestamps reflect UTC time, then you’re good to go. If they represent local times then the timestamps should include the UTC offset.
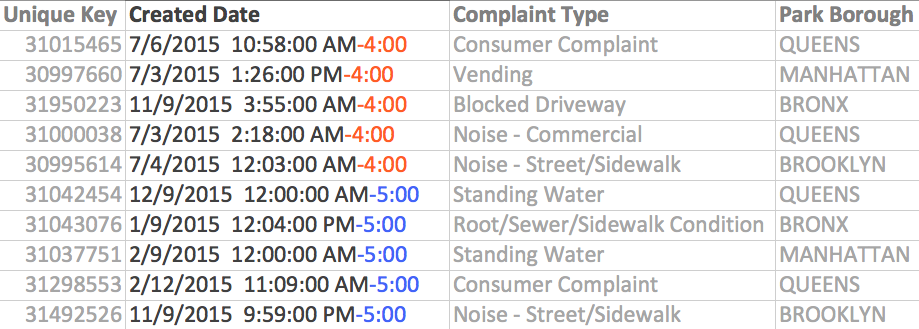
This is particularly important for data that spans more than one time zone. Even if the data was collected in the same time zone, the offset helps determine if it represents time during Daylight Savings Time or Standard Time. For example, if you collect data in the Eastern Time Zone, then the offset to append to the time would be -4 during Daylight Savings Time and -5 during Standard Time. See the image below for an example of how to indicate this in a CSV file intended for publishing as a hosted feature service in ArcGIS Online.
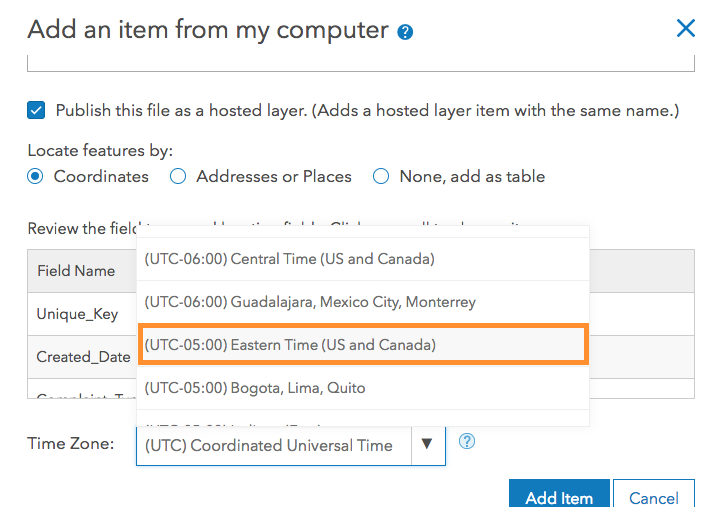
However, publishing data from a CSV file to ArcGIS Online simplifies the process for you. If the data is collected in the same time zone but doesn’t include the offset information, you can indicate the time zone offset when you publish the data to ArcGIS Online. Check out this blog, which goes more in depth about the various things you should consider when publishing time data to ArcGIS Online, whether from CSV or from ArcGIS Pro.
When entering date and time data, just remember to either record dates using UTC times or to include the UTC offset in the date field. Consistency is the key. It will make your project much easier to work with later. Read the ArcGIS Online documentation for working with date fields for more information about the publishing process.
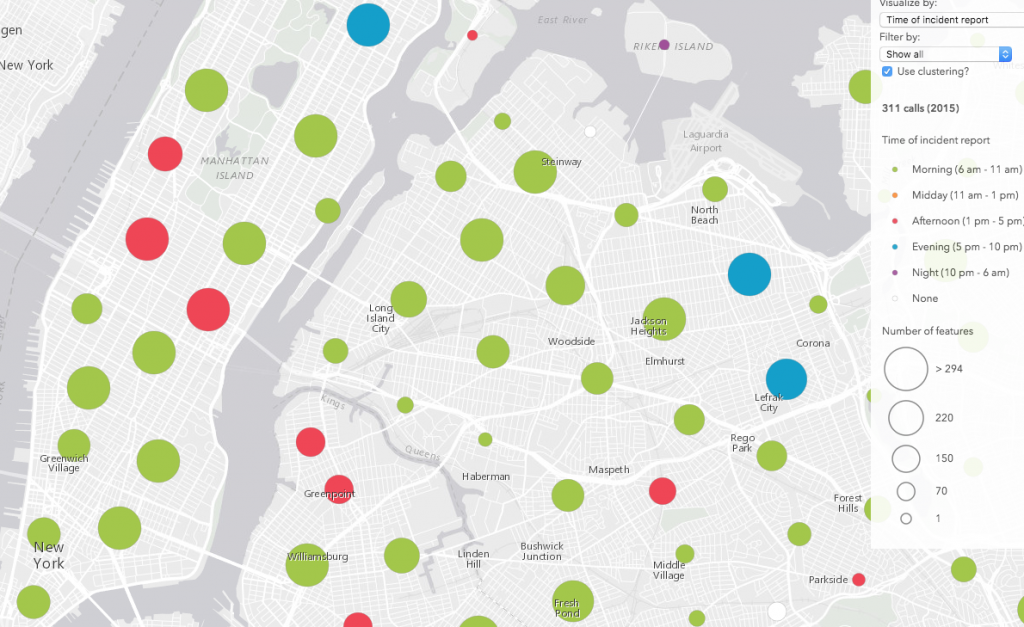
Time of day – in one time zone
In the 311 exploration app referenced above, the data was recorded in Eastern time. So we know we can publish the CSV data as a hosted feature service with the appropriate time offset of -4 or -5. Remember, we attempted to visualize incidents based on the time of day in the locations where they were reported. Features are visualized with unique values depending on whether they occurred in the morning, midday, afternoon, evening, or night. Here’s the starting expression for reference (note that my interpretation of “time of day” may be different from yours):
var t = Hour($feature.Created_Date);
When(
  t >= 22 || t < 6, "Night",
  t >= 6 && t < 11, "Morning",
  t >= 11 && t < 13, "Midday",
  t >= 13 && t < 17, "Afternoon",
  t >= 17 && t < 22, "Evening",
"Invalid date" );
The t variable represents the hour of the day the incident was created. The When() logical function is used to evaluate the hour in several predefined ranges. It then returns a string indicating the relative time of day the incident occurred.
But this is where we need to hit the brakes. It is important to note that Arcade, like JavaScript, interprets dates in the locale of the browser running the app. Since we’re dealing with data collected in New York City, this expression would only display the proper visualization for browsers running the app in the Eastern Time Zone.
If I run this expression in the Pacific Time Zone, I see the visualization on the left (click the images to view larger versions of them). The correct visualization is on the right (as seen in the Eastern Time Zone).
| Pacific Time Zone | Eastern Time Zone |
 |
 |
It may be confusing initially, but “time of day” is always relative to your location. Think about it: 6:30 a.m. EST is “morning” for the east coast, but people on the west coast are likely still in bed since it is 3:30 a.m. PST locally. That’s why the above expression will produce a different visualization for people in different time zones.
We’ll need to modify the expression so it always interprets the dates in Eastern time rather than the local time of the browser, so anyone who views the app anywhere in the world will see the same visualization. To accomplish this we need to convert the time to its UTC equivalent and offset that time based on a fixed offset for Eastern time. Since Eastern Standard Time is 5 hours behind UTC, we could set the offset to a fixed -5.
// convert the time to Eastern Standard Time
var easternTime = DateAdd(ToUTC($feature.Created_Date), -5, "hours");
// Time of day
var t = Hour(easternTime);
When(
  t >= 22 || t < 6, "Night",
  t >= 6 && t < 11, "Morning",
  t >= 11 && t < 13, "Midday",
  t >= 13 && t < 17, "Afternoon",
  t >= 17 && t < 22, "Evening",
"Invalid date" );
OK. We’re close, but not quite there yet. The only missing component of this expression is acknowledgement of Daylight Savings Time. When Daylight Savings Time is in effect, the Eastern Time Zone is only 4 hours behind UTC. Therefore, we need to account for Eastern Standard Time or Eastern Daylight Time with the appropriate offset.
The threshold for moving from Standard Time to Daylight Time and vice versa is different every year. Since the data in the 311 app only shows incidents from 2015, we can check the date to see if it falls between March 8 and November 1. If it does, then it has an offset of -4. Otherwise, the offset will assume Standard Time (-5).
// Only valid in 2015
function toEasternTime(localDate){
  var d = toUTC(localDate);
  var yr = Year(d);
  // Eastern time zone offsets from UTC
  var edt = -4;
  var est = -5;

  // Nov 1, 2015 2:00 a.m. (UTC)
  var stStart = Date(2015, 10, 1, 2 + Abs(edt));
  // Mar 8, 2015 2:00 a.m. (UTC)
  var dtStart = Date(2015, 2, 8, 2 + Abs(est));

  var inDaylightTime = (d >= dtStart) && (d < stStart);
  var timeOffset = IIF(inDaylightTime, edt, est);
  return DateAdd(d, timeOffset, "hours");
}

var created = toEasternTime($feature.Created_Date);

// Time of day
var t = Hour(created);
When(
  t >= 22 || t < 6, "Night",
  t >= 6 && t < 11, "Morning",
  t >= 11 && t < 13, "Midday",
  t >= 13 && t < 17, "Afternoon",
  t >= 17 && t < 22, "Evening",
"Invalid date" );
But what if your data spans multiple years? You could take this expression a step further and add two more functions for determining the starting and ending date of Daylight Savings based on a given year. For example, they could look like this:
//
// Only valid in the U.S. after 2007
//
function getStandardTimeStart(y){
  // Daylight savings time ends on the
  // first Sunday in November
  var st;

  for(var d=1; d<8; d++){
    var tempDate = Date(y, 10, d, 2);
    st = IIF(Weekday(tempDate)==0, tempDate, st);
  }

  return st;
}

function getDaylightTimeStart(y){
  // Daylight savings time starts on the
  // second Sunday in March
  var dt;

  for(var d=1; d<15; d++){
    var tempDate = Date(y, 2, d, 2);
    dt = IIF(Weekday(tempDate)==0, tempDate, dt);
  }

  return dt;
}
See the full expression using the above functions on GitHub.
Time of day – in multiple time zones
We took a small expression and expanded it out to properly display time of day taking Daylight Savings into account for data that spans multiple years. But the data in this case only sits in one time zone.
How do you take multiple time zones into account? The expression would certainly have to be much longer, right? The answer to the latter question could be “yes”, but that doesn’t have to be the case if you carefully prepare your data beforehand. For example, if the dataset includes an attribute field that indicates the UTC offset of each feature’s location, then you can just apply the offset to get the local time without making all the caveats in the previous examples.
Take a look at the metadata for the USGS real-time earthquake data for an example of this. Then navigate to a field named tz. Bingo. That’s exactly what we want in this scenario. The tz field indicates the time zone offset of each earthquake’s epicenter in minutes from UTC time.
So the expressions above would be condensed to look like this:
var localTime = DateAdd(ToUTC($feature.time), $feature.tz, "minutes");
var t = Hour(localTime);
When(
  t >= 22 || t < 6, "Night",
  t >= 6 && t < 11, "Morning",
  t >= 11 && t < 13, "Midday",
  t >= 13 && t < 17, "Afternoon",
  t >= 17 && t < 22, "Evening",
"Invalid date" );
Expressions generating time of day visualizations referencing data that spans multiple time zones can be simplified as long as the data contains an attribute field indicating the time zone offset on a feature-by-feature basis. Check out this 3D app that employs this logic.
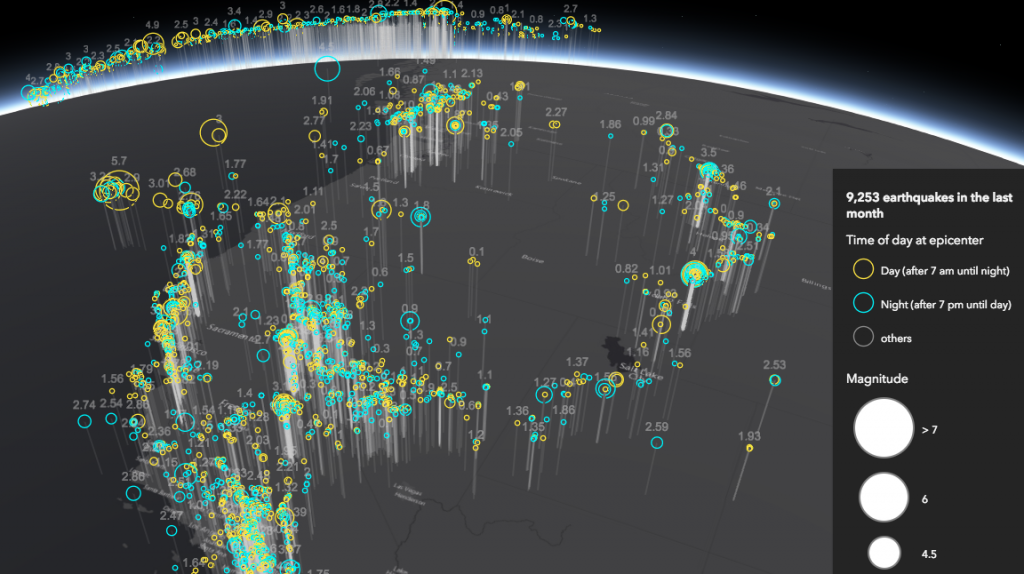
You’ll notice, however, that the time of day categories were reduced to just “day” vs. “night” to make the visualization easier to decipher. The expression was therefore simplified to the following.
var localTime = DateAdd(ToUTC($feature.time), $feature.tz, "minutes");
var h = Hour(localTime);
IIF(h >= 7 && h < 19, "day", "night");
Bear in mind that this visualization doesn’t have any real meaning; time of day does not play a factor in where or how strong earthquakes are when they occur. Nor does it indicate patterns for when future earthquakes will occur in regions prone to them. This is merely a demonstration of how much better it is to include the UTC offset in your data rather than writing custom logic in Arcade to handle it for you.
Open the app and click on a few features. The popup displays the time of the earthquake’s occurrence in the time zone it occurred, UTC time, and your local time. If you pay close attention, you may notice the offsets only assume Standard Time, so Daylight Savings isn’t taken into account. If I click an earthquake in California, the local time and my browser time should match. However, since the earthquake occurred during the Daylight Savings timeframe, the time is off an hour.
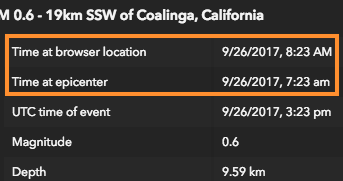
We could implement logic for determining if the event occurred during Daylight Time versus Standard Time, but since Daylight Savings is applied differently all over the world (or not used at all), you might want to cut your losses and say the visualization is good enough. ¯_(ツ)_/¯
Sometimes concessions like this are OK as long as you are transparent with your audience regarding the caveats, gotchas, and general issues present in your time visualizations.


Article Discussion: