I regularly check the Open Data portals because there’s always some new, interesting dataset out there. Recently, I stumbled upon data of independent art galleries in New York City on the NYC OpenData portal and decided to create a scene with them. I was amazed that New York City has so many art galleries…especially in Manhattan. I wanted to give more context to the scene, so I also downloaded the NYC building data. Since this is a scene about art, a natural choice for the basemap was the Watercolor basemap from Stamen. See a live demo here.
After publishing the point and buildings data to ArcGIS Online, I was ready to start with the real fun part: visualizing the art galleries using ArcGIS API for JavaScript.
Visualize buildings
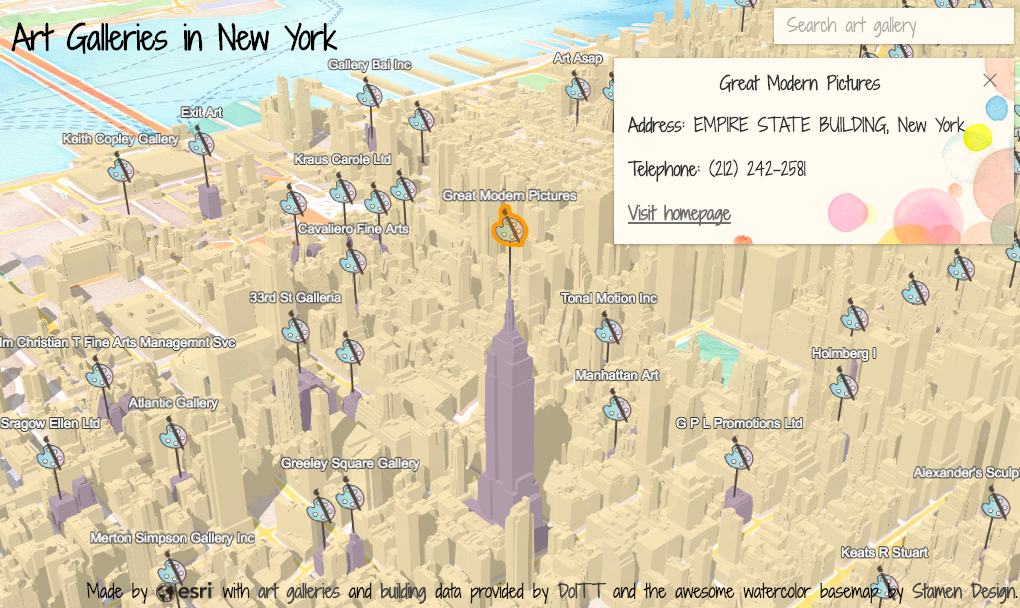
Visualization of the New York buildings was an important step to give a sense of place in the scene. For example, the buildings make it easier to locate art galleries. With this in mind, I shaded in purple buildings that have at least one art gallery. The rest I left beige. To accomplish this, I used a ClassBreaksRenderer:
var renderer = new ClassBreaksRenderer({
  field: "NoArtGalleries",
  defaultSymbol: new MeshSymbol3D({
    symbolLayers: [new FillSymbol3DLayer({
      material: {
        color: [255, 235, 190, 0.9]
      }
    })]
  }),
  classBreakInfos: [{
    minValue: 1,
    maxValue: 30,
    symbol: new MeshSymbol3D({
      symbolLayers: [new FillSymbol3DLayer({
        material: { color: [187, 165, 181, 1] }
      })]
    })
  }]
});
Visualize points of interest
With the new features in ArcGIS API 4.4 you can now create really nice visualizations of points of interest where the scene is balanced and easy to read.
First of all, I used a simple renderer to display all the points with the same icon:
var renderer = new SimpleRenderer({
  symbol: new PointSymbol3D({
    symbolLayers: [new IconSymbol3DLayer({
      resource: {
       href: "./img/icon.png"
      },
      size: 28
    })]
  })
});
In this dataset there are 917 art galleries and many of them are inside buildings. Therefore icons will be hidden by buildings when looking at the scene in a detailed tilted view (see image below on the left). In a smaller scale view of New York, the icons fully cover the scene (image on the right).
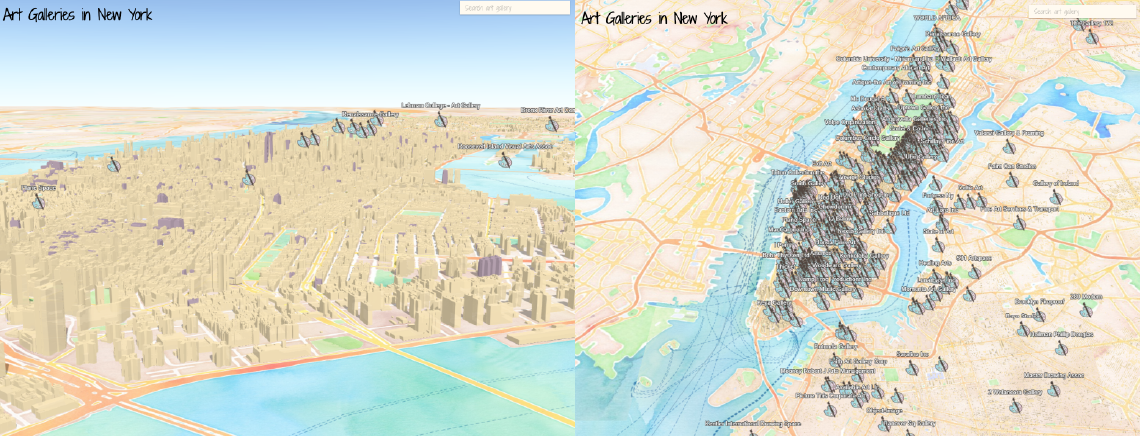
Luckily, with the new features of ArcGIS API 4.4 this can be fixed.
Show points inside buildings
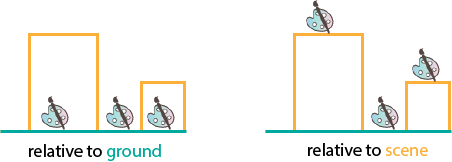
If a point of interest is located inside the building, you can’t see it because it is hidden by the building’s geometry.
This can be solved by placing the point of interest on the rooftop of the building. In more technical terms, I can display the point relative to the height of the building scene layer at the location of the point. In the image below the yellow buildings represent scene layer features and the ground is green. With the points aligned to the scene, the art galleries are no longer on the ground, but relative to the building rooftops.
To enable this feature, I need to set the elevationInfo mode of the layer to relative-to-scene:
var pointsOfInterest = new FeatureLayer({
  ...,
  elevationInfo: {
    mode: "relative-to-scene"
  }
});
Relative to scene mode currently only works for point geometries.
Declutter the scene
Now I can see the icons, but I have the opposite problem: in some areas there are so many art galleries that when I zoom out points overlap each other which makes the scene look very crowded.
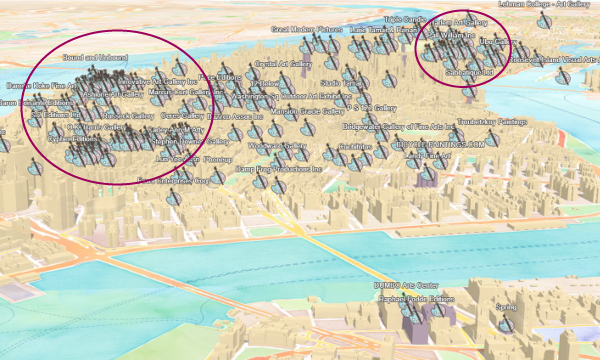
I can now filter out overlapping icons by using a new layer property called featureReduction. This ensures that all icons are visible at a large city scale, without cluttering the scene at a small scale.
var pointsOfInterest = new FeatureLayer({
  ...,
  featureReduction: {
    type: "selection"
  }
});
Understand the real location of the point
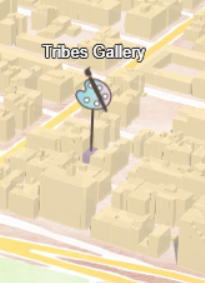
No matter how good you are at reading maps, in 3D it’s quite hard to tell where an icon is located just by looking at the scene. Have a look at this point:
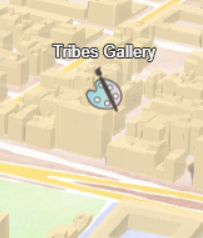
You’d have to pan and rotate to actually figure out to which building the art gallery belongs. This experience can now be improved by using callout lines that point to the actual location of each point. So now you can clearly see this point is located in the purple building behind:
Callouts are set on a symbol level. First, you need to vertically shift the point with a vertical offset:
verticalOffset: {
  screenLength: 40,
  maxWorldLength: 200
}
Next you can set the callout (for now only callouts of type line are supported):
callout: new LineCallout3D({
  color: "#534741",
  size: 1
})
The vertical offset shifts the point in the vertical direction and the callout adds the line corresponding to that offset. Callout lines only work together with the vertical offset.
Improve depth perception
Now my scene looks like this:

You might notice that the icons in the back are smaller than the icons in the front. That’s because we worked on improving depth perception. screenSizePerspectiveEnabled is a property at the layer level that automatically calculates the size of icons based on the distance to the camera. By default it is set to true, so if there are visual variables with size, the setting should be set to false.
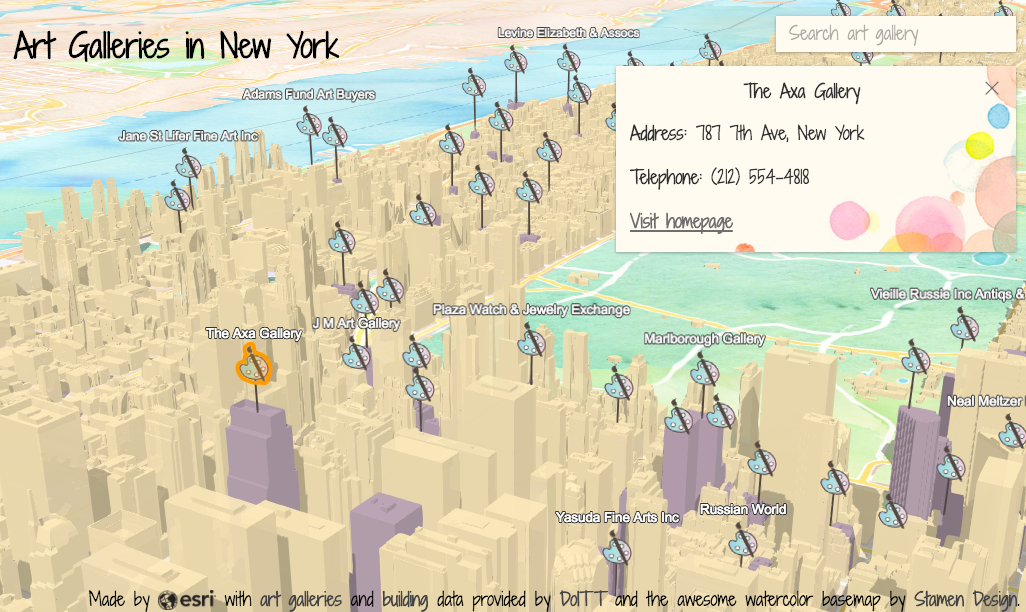
Last but not least, I added a search widget to search for features in the art galleries layer and a popup to show more information about each one of the art galleries.
Check the live scene here.
Feel free to drop a comment in case you used any of these features. I’d love to know what you created with them!
Raluca


Commenting is not enabled for this article.