In a session titled 3D Visualization with the ArcGIS API for JavaScript at the 2017 Esri User Conference (UC), Javier Gutierrez and I demonstrated some of the new visualization capabilities available in the JavaScript API. I’m particularly excited about Smart Mapping, which is a set of APIs that allow developers to generate good-looking default visualizations for layers based on a given field value. One of the new capabilities released in Smart Mapping this year was added support for 3D object scene layers.
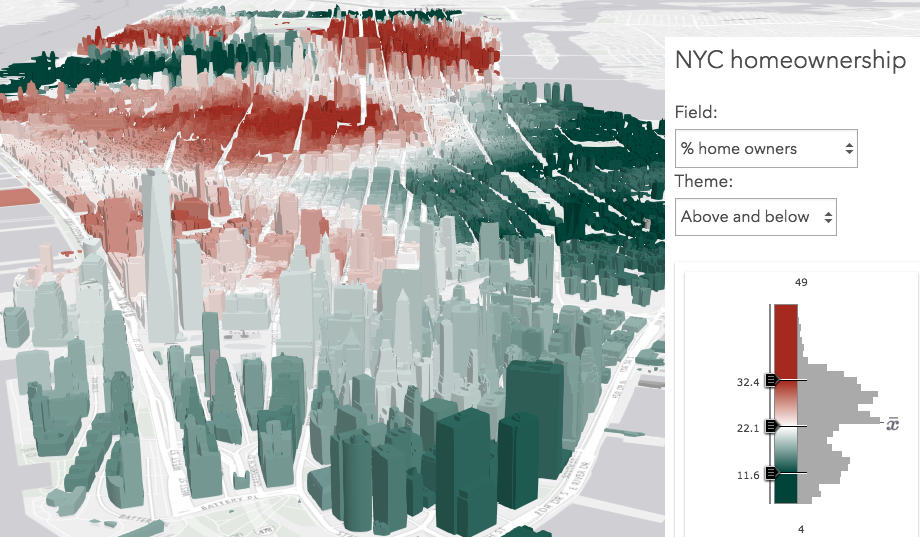
During our presentation at the UC, we showed off this sample, which allows users to explore home ownership data in New York City. The app contains a single SceneLayer of 3D buildings in Manhattan and exposes a barebones UI that allows users to explore the data. This data is typically captured by an automated process for constructing 3D objects from large sets of overlapping imagery. A colleague created a scene layer of the building data, which comes from the NYC 3-D Building Model, and used geoenrichment to add two attributes: the percentage of the population that are homeowners, and the average home value. Check it out. It makes for some cool looking visuals.
Configure your own data exploration app
As noted throughout the documentation of the ArcGIS API for JavaScript, you should only use the Smart Mapping APIs for custom data exploration apps and visualization authoring apps (similar to the ArcGIS Online map and scene viewers). Also note that Smart Mapping in 3D is limited to point and 3D object data layers.
In a nutshell, the Smart Mapping APIs consist of a set of methods used for generating statistics, renderers, and visual variables. In this app, I call the createContinuousRenderer() method in the colorRendererCreator object to generate my renderer. Only three parameters are required: layer, field, and basemap. I also like to allow the user to set the theme parameter since switching the theme allows them to see the data from different perspectives.
Once the promise resolves, you can set the renderer back to the layer and the view will automatically update.
var colorParams = {
  layer: layer,  // scene layer instance created earlier in the app
  basemap: map.basemap,  // This could be any Esri basemap, such as "dark-gray"
  field: "OWNER_P",  // field name for attribute containing % of homeowners
  theme: "above-and-below"  // other values: high-to-low (default) | centered-on | extremes
};

colorRendererCreator.createContinuousRenderer(colorParams)
  .then(function (response) {
    // set the renderer to the layer
    layer.renderer = response.renderer;
  });
Further down the app, I construct an instance of ColorSlider and listen to the data-change event (essentially on-slide) and apply the visual variable represented in the slider back to the renderer on the layer. This allows the user to quickly change the visualization to explore the dataset. I also generated a histogram using the histogram() method available in the API. This can be set on the slider so the user can get an overview of the spread of the data.
var colorParams = {
  layer: layer,  // feature layer instance created earlier in the app
  basemap: map.basemap,  // This could be any Esri basemap, such as "dark-gray"
  field: "OWNER_P",  // field name for attribute containing % of homeowners
  theme: "above-and-below"  // other values: high-to-low (default) | centered-on | extremes
};

colorRendererCreator.createContinuousRenderer(colorParams)
  .then(function (response) {

    // set the renderer on the layer
    layer.renderer = response.renderer;

    var histogramParams = {
      layer: colorParams.layer,
      field: colorParams.field,
      numBins: 30
    };
    return histogram(histogramParams)
      .then(function (histogram) {

        // add the statistics and color visual variable objects
        // to the color slider parameters

        var sliderParams = {
          container: "slider",
          numHandles: 3,  // can only be 2 or 3 handles
          syncedHandles: true,
          statistics: response.statistics,
          visualVariable: response.visualVariable,
          histogram: histogram,
          minValue: response.statistics.min,
          maxValue: response.statistics.max
        };

        var colorSlider = new ColorSlider(sliderParams);
        // when the user slides the handle(s), update the renderer
        // with the updated color visual variable object

        colorSlider.on("data-change", function () {
          var renderer = layer.renderer.clone();
          renderer.visualVariables = [lang.clone(colorSlider.visualVariable)];
          layer.renderer = renderer;
        });
      });
  });
I also added a select element allowing the user to explore data in different fields. When the user selects a new field name, the generator function is executed once again and the renderer updates with a new default renderer. You can also make the app more configurable and allow the user to visualize different layers based on field values selected from an auto-populated list.
Working with SceneLayers
Not all SceneLayer fields can be used for rendering purposes. SceneLayer attributes may be stored in the service cache or as part of a data-connected feature layer depending on how the SceneLayer was published. If the SceneLayer has an associated portal item on ArcGIS Online or an on premise portal, then create the layer using the portal item ID. That will ensure that attributes can be properly queried for statistics if the layer is a data-connected scene layer.
Depending on where the attributes are stored will determine whether the field may be used for visualization or rendering purposes. The getFieldUsageInfo() method on SceneLayer is convenient for checking which capabilities are supported for a given field. If your app allows users to input their own scene layer, then be sure to check the fields for renderer support prior to attempting to use it in the Smart Mapping API.


Article Discussion: