Update: Here is an ArcGIS Pro project package that get get you going on creating a firefly basemap, like the one used here.
This is a map showing where, in the past four years, nighttime lights have appeared, or been extinguished. This blog post shows you the (pretty easy) nitty gritty of how it was made in ArcGIS Pro. If you want to fall into a rapturous story map of the analysis, then you can do that here.

It was built using ArcGIS Pro using a raster function. It’s super easy, fun, and the results are an interesting black hole, into which you will tumble -emerging hours later unaware of the time that has passed. Here’s how it goes…
Background
Last week, Joshua Stevens, and the NASA Visible Earth team, released the most recent version of the achingly beautiful Earth At Night maps, from a series of nighttime images captured via satellite and processed to show areas of nighttime illumination. The most recent time they had done this was 2012. So, in the intervening years, many lights have come on…and some have gone off.
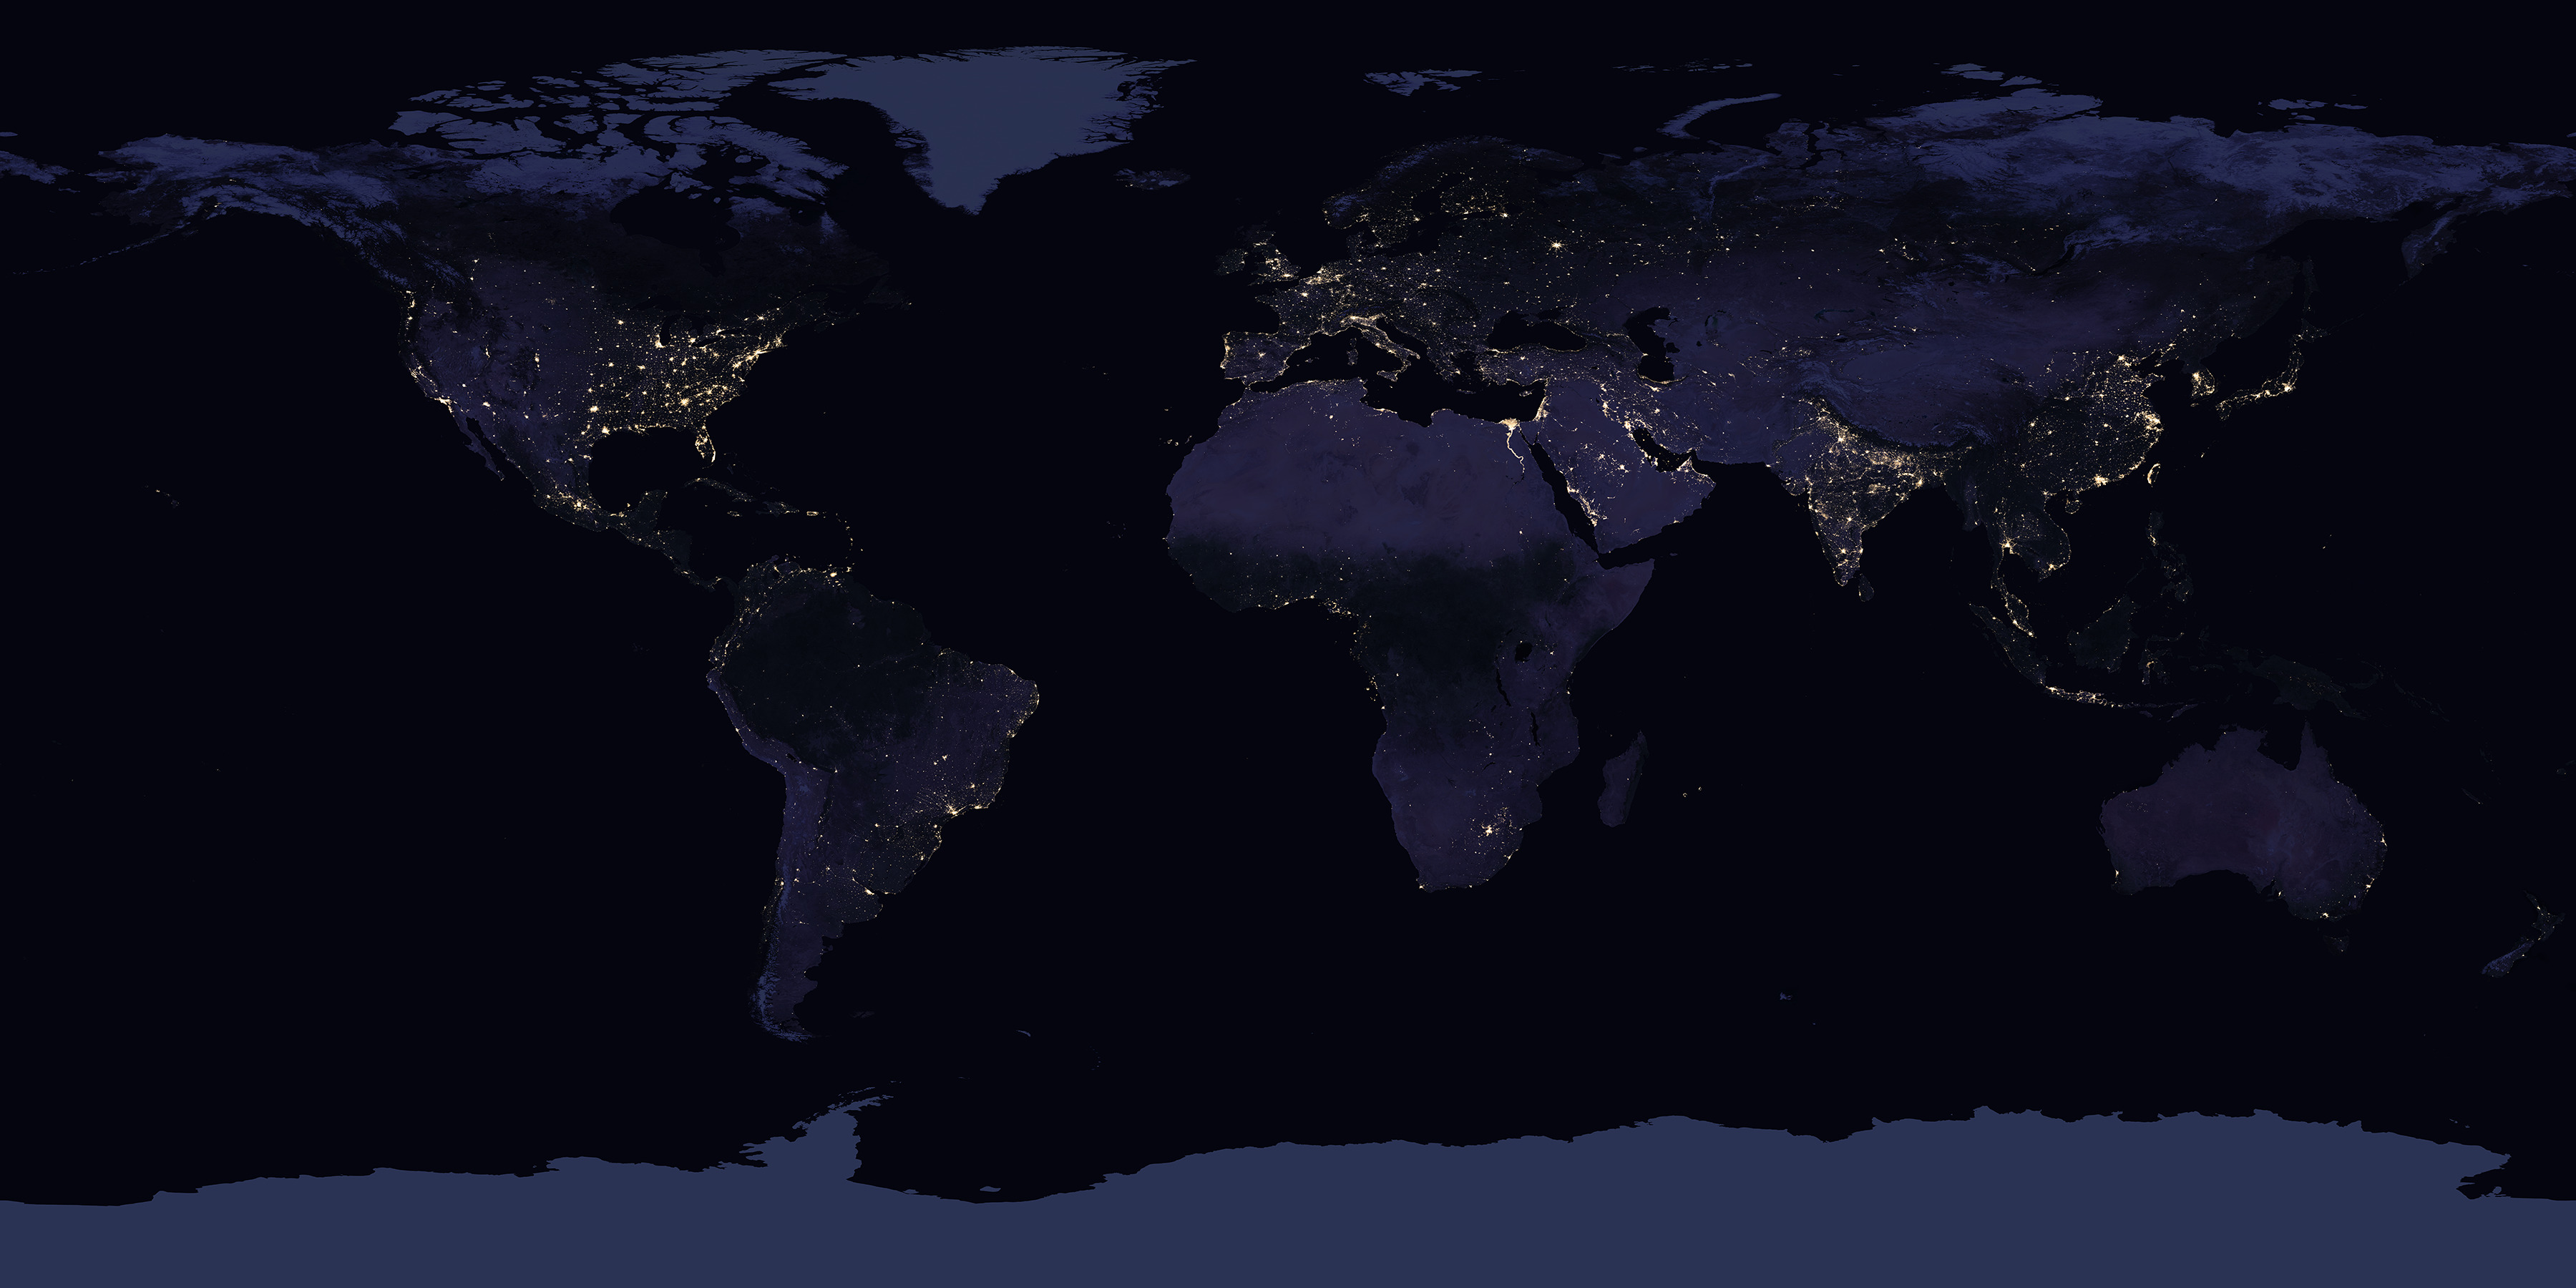
Their announcement provided a few before/after swipe images highlighting a handful of interesting places. It was unreasonably fun for me to swipe back and forth, looking for changes.
Since I am always on the lookout for ways that will reduce the load on my already-taxed cognitive capabilities, I wondered if I might outsource some of that mental effort of looking for change via one of ArcGIS Pro’s raster functions.
How To
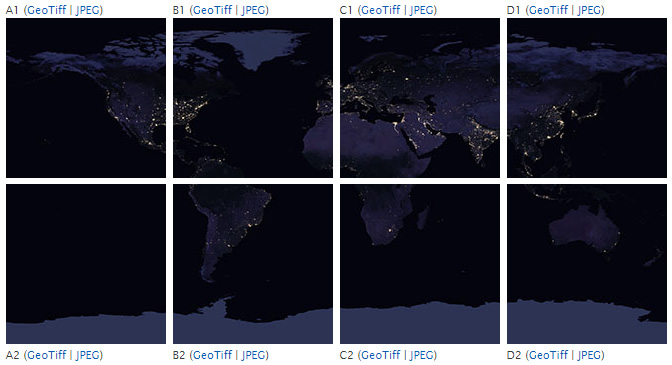
I downloaded the eight high-res Earth At Night images that combine to cover the earth.
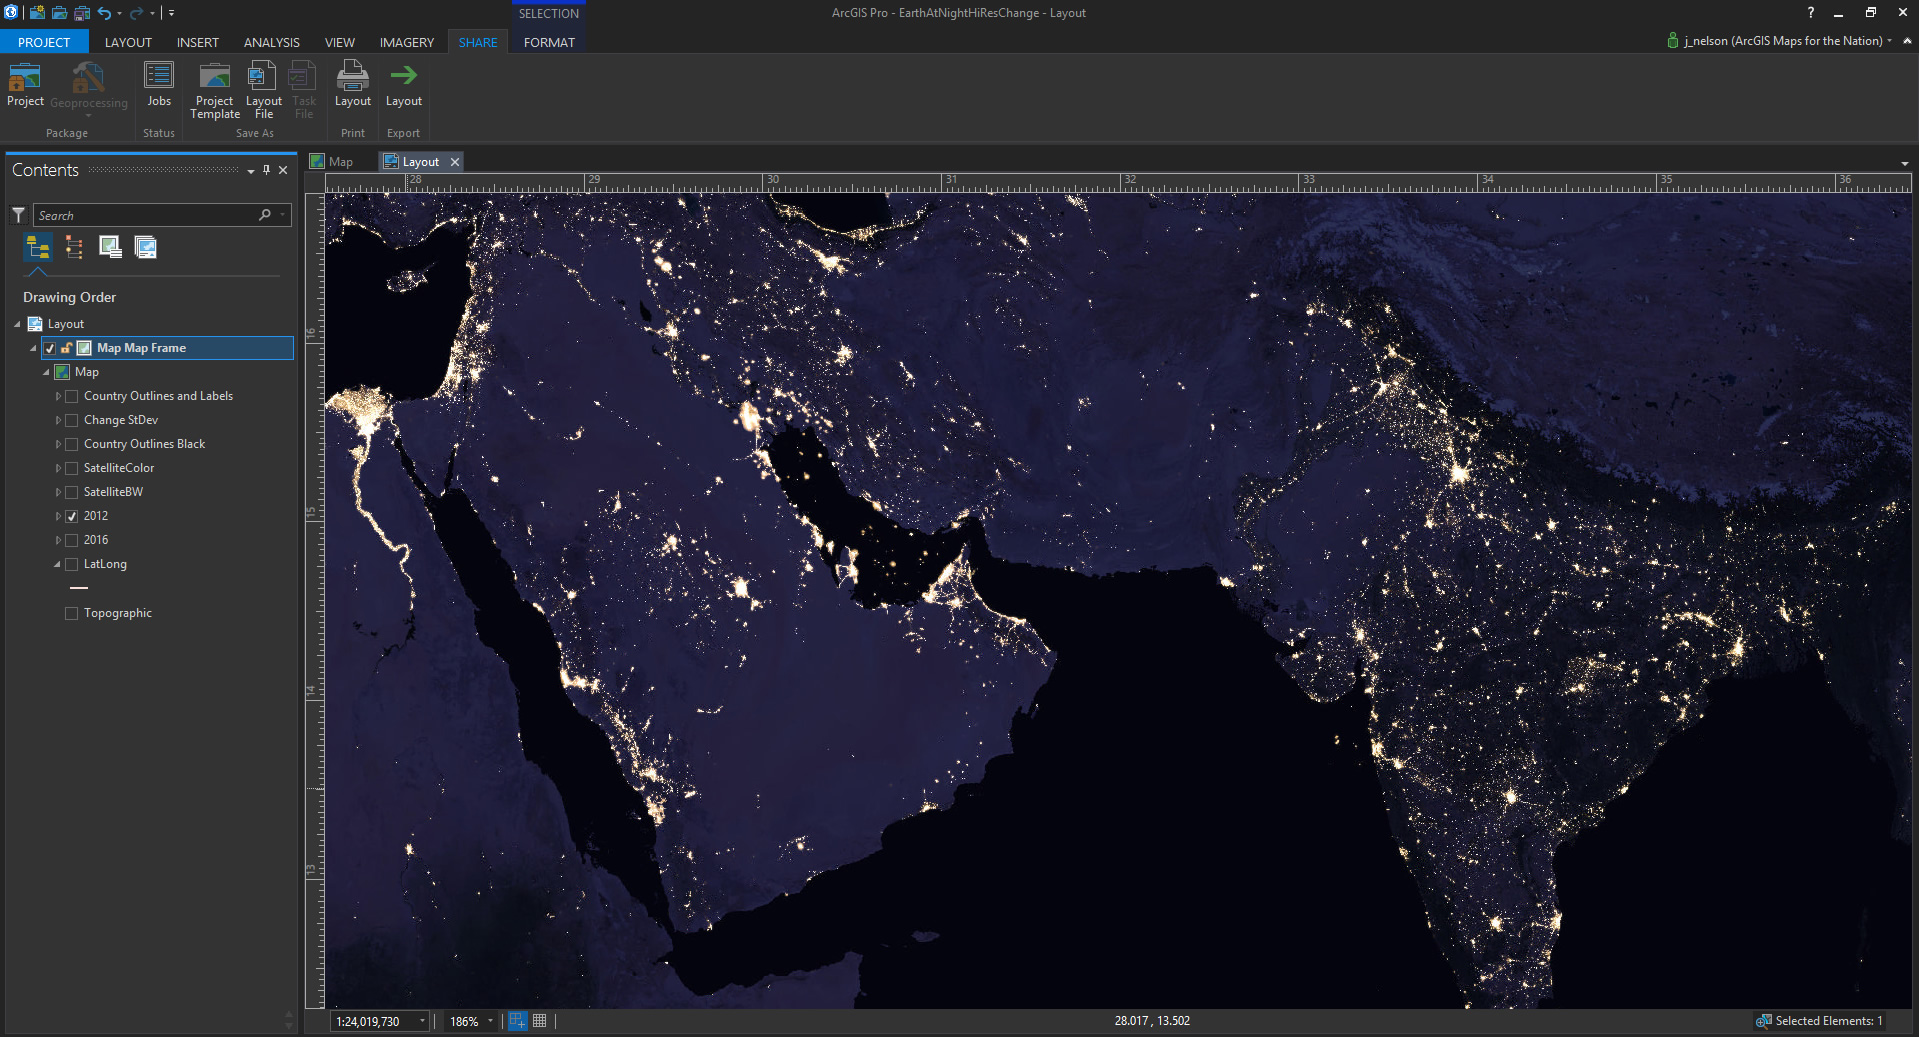
Here’s a look at the Earth At Night imagery in ArcGIS Pro. This is the 2012 version…
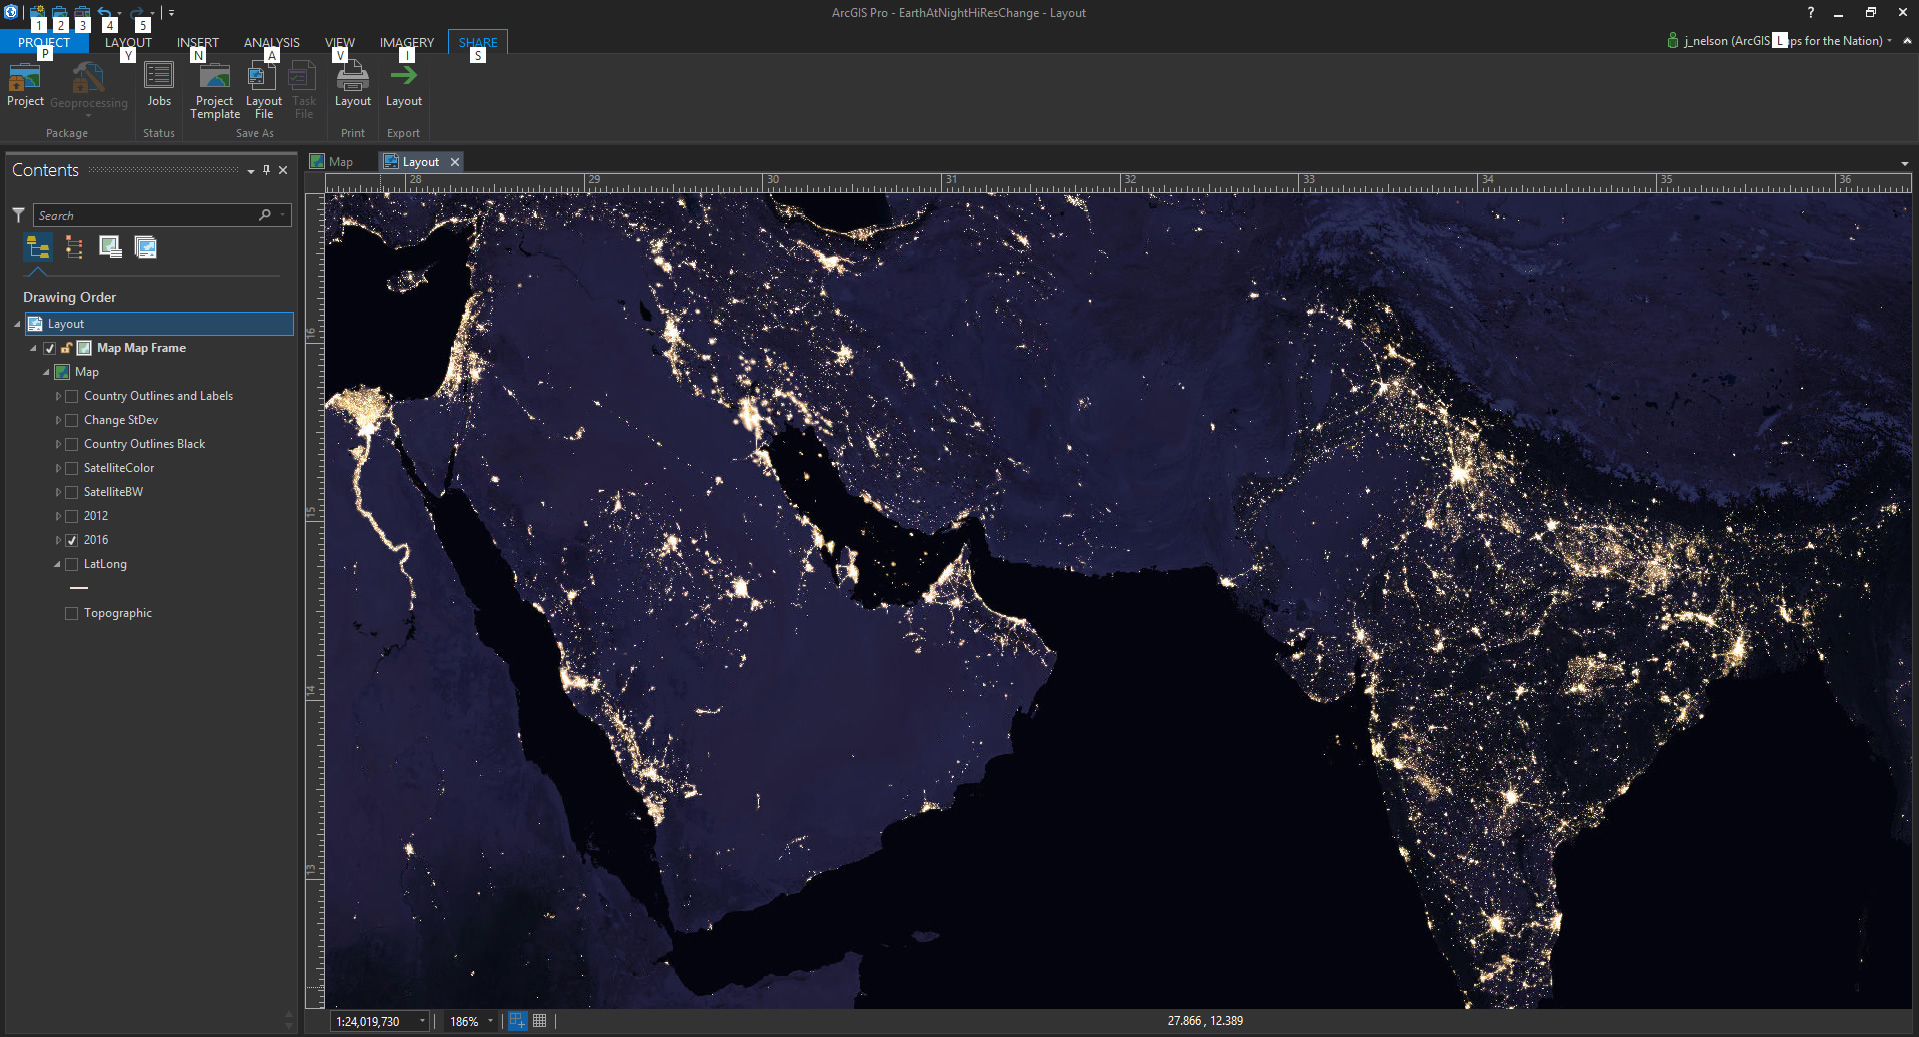
And here is the luscious 2016 version (released in 2017, you know, but from 2016 data)…
It’s time to mash these things together, so we don’t have to use our brains to see where lights are different. In the Imagery tab, there is a button called, “Raster Functions.” There are loads of canned robot hordes ready to unleash their algorithms on your data.
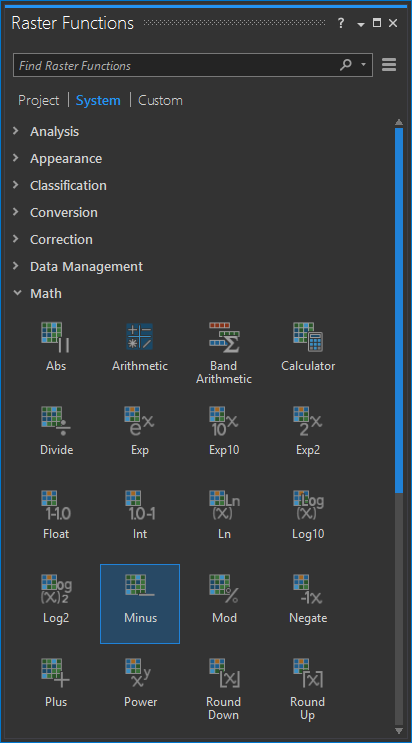
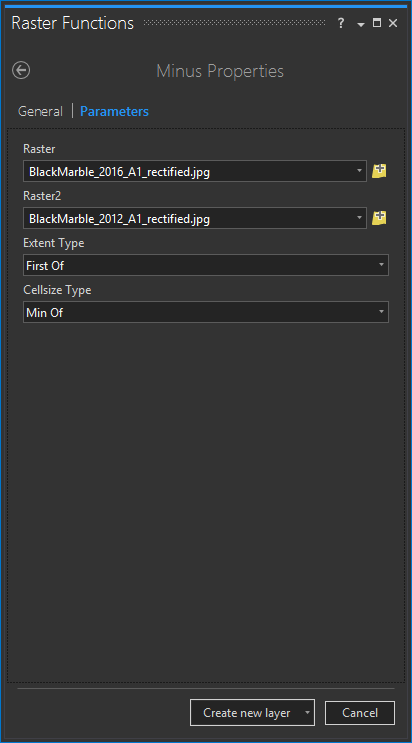
Since I want to simply see the change from 2012 to 2016, I’ll choose the “Minus” function. This just subtracts the pixel values of one image from the other. Real basic change.
Here’s the resulting image, showing where lights have increased or decreased between the two images. It is a really basic more or less sort of image, in grayscale.
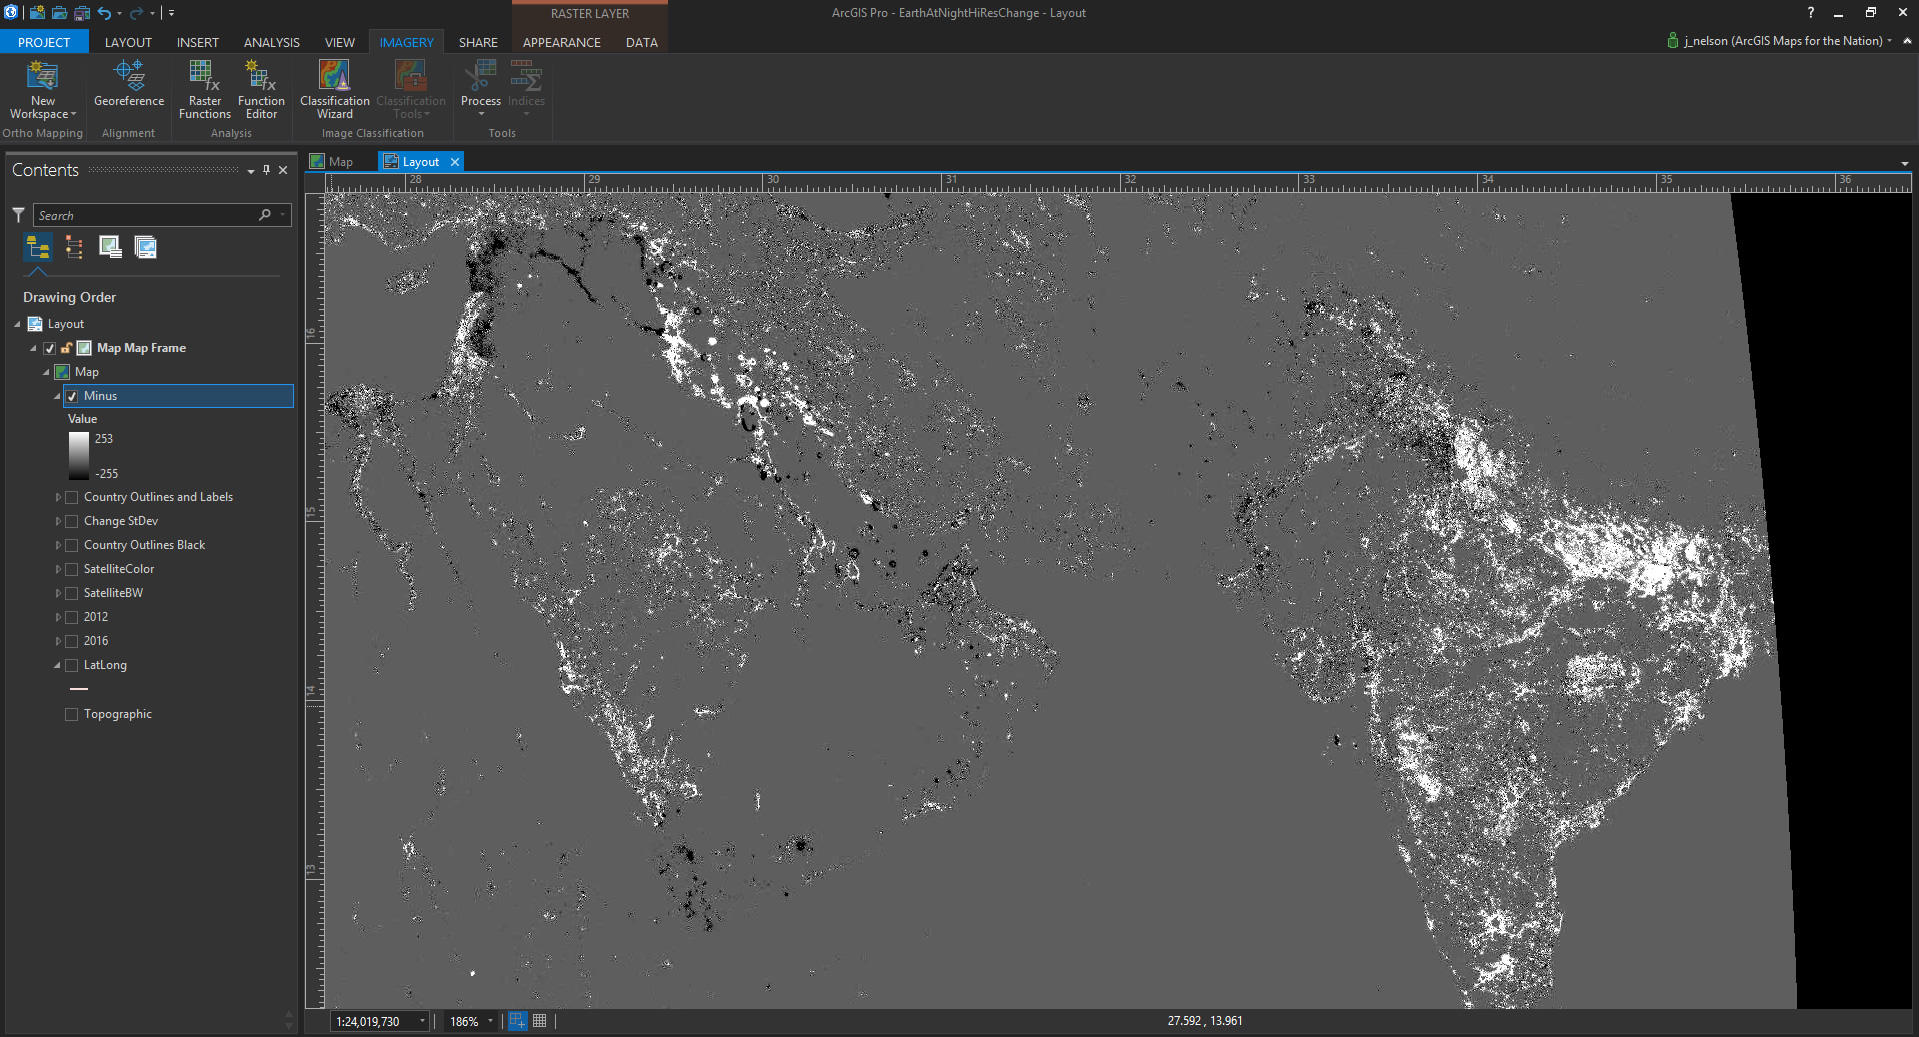
The default symbology for this change image is a black (less) to gray (same-ish) to white (more) visual.
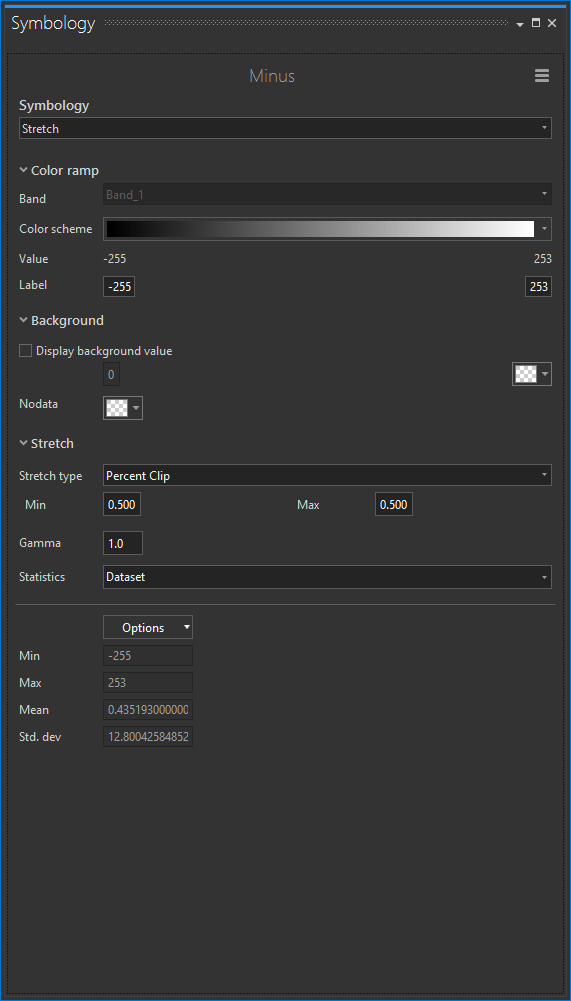
But since I don’t really care to see the unchanged pixels, I can just make them fully transparent. On the less-light end, I paint the pixels a magenta color; the more-light pixels I paint blue. I also want to be a bit more conservative about how strongly I consider change, so I set the stretch type to 4 standard deviations, pushing the coloration out to the edges of the change data.
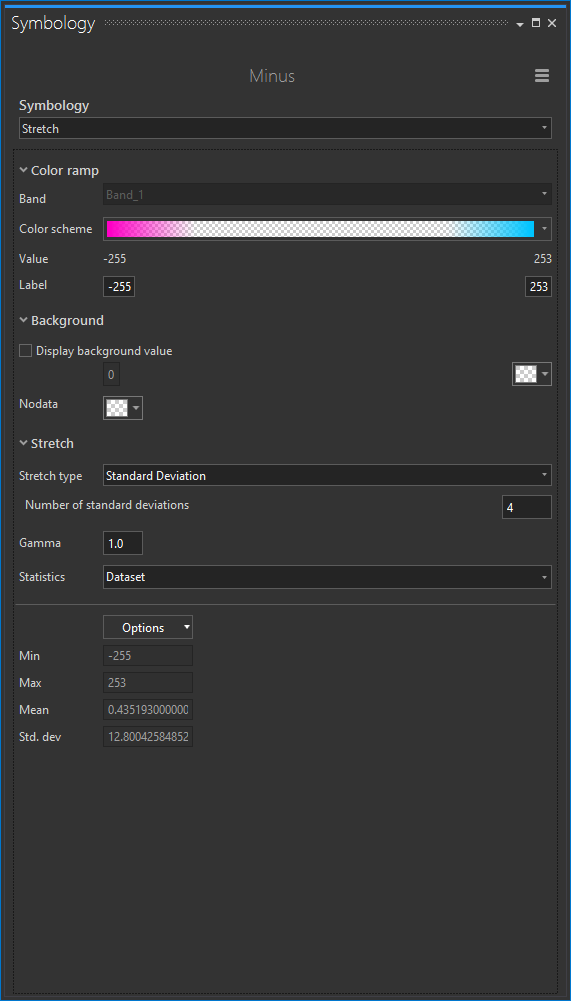
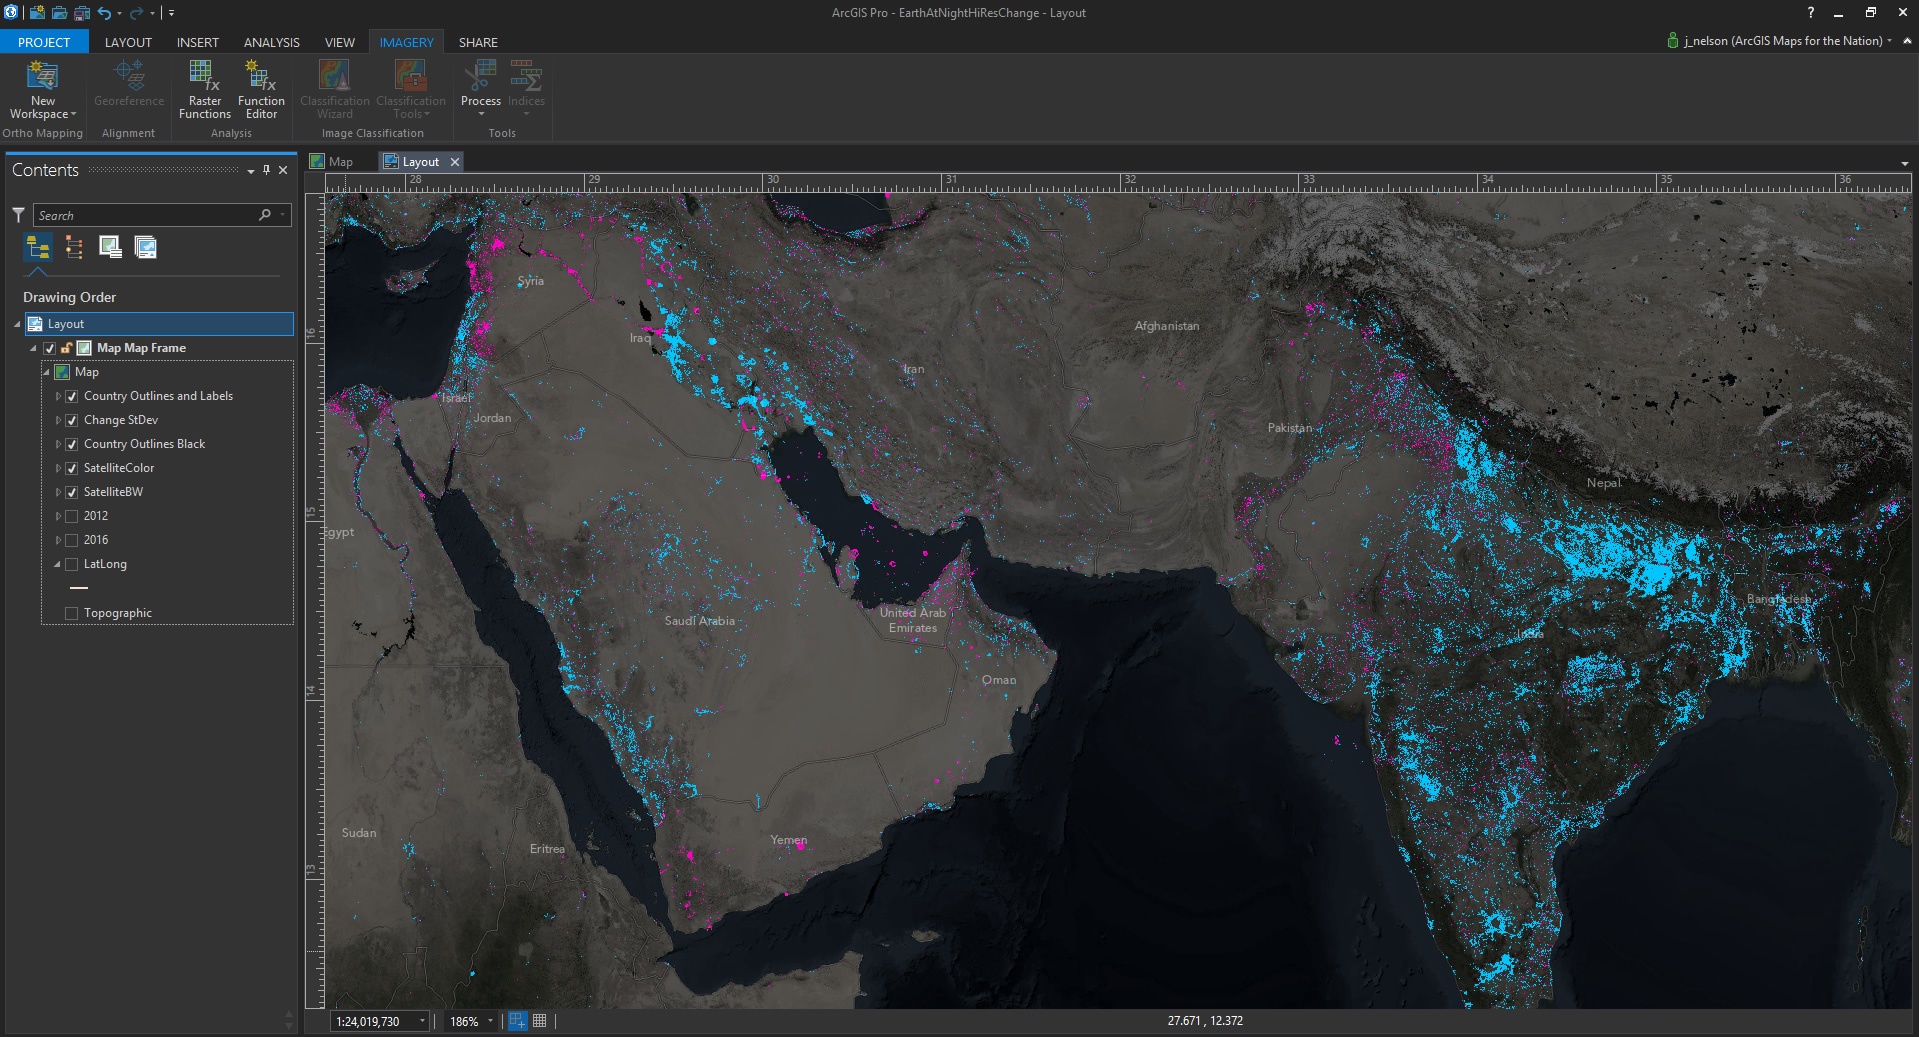
The result of this enbetterified symbology looks like this…
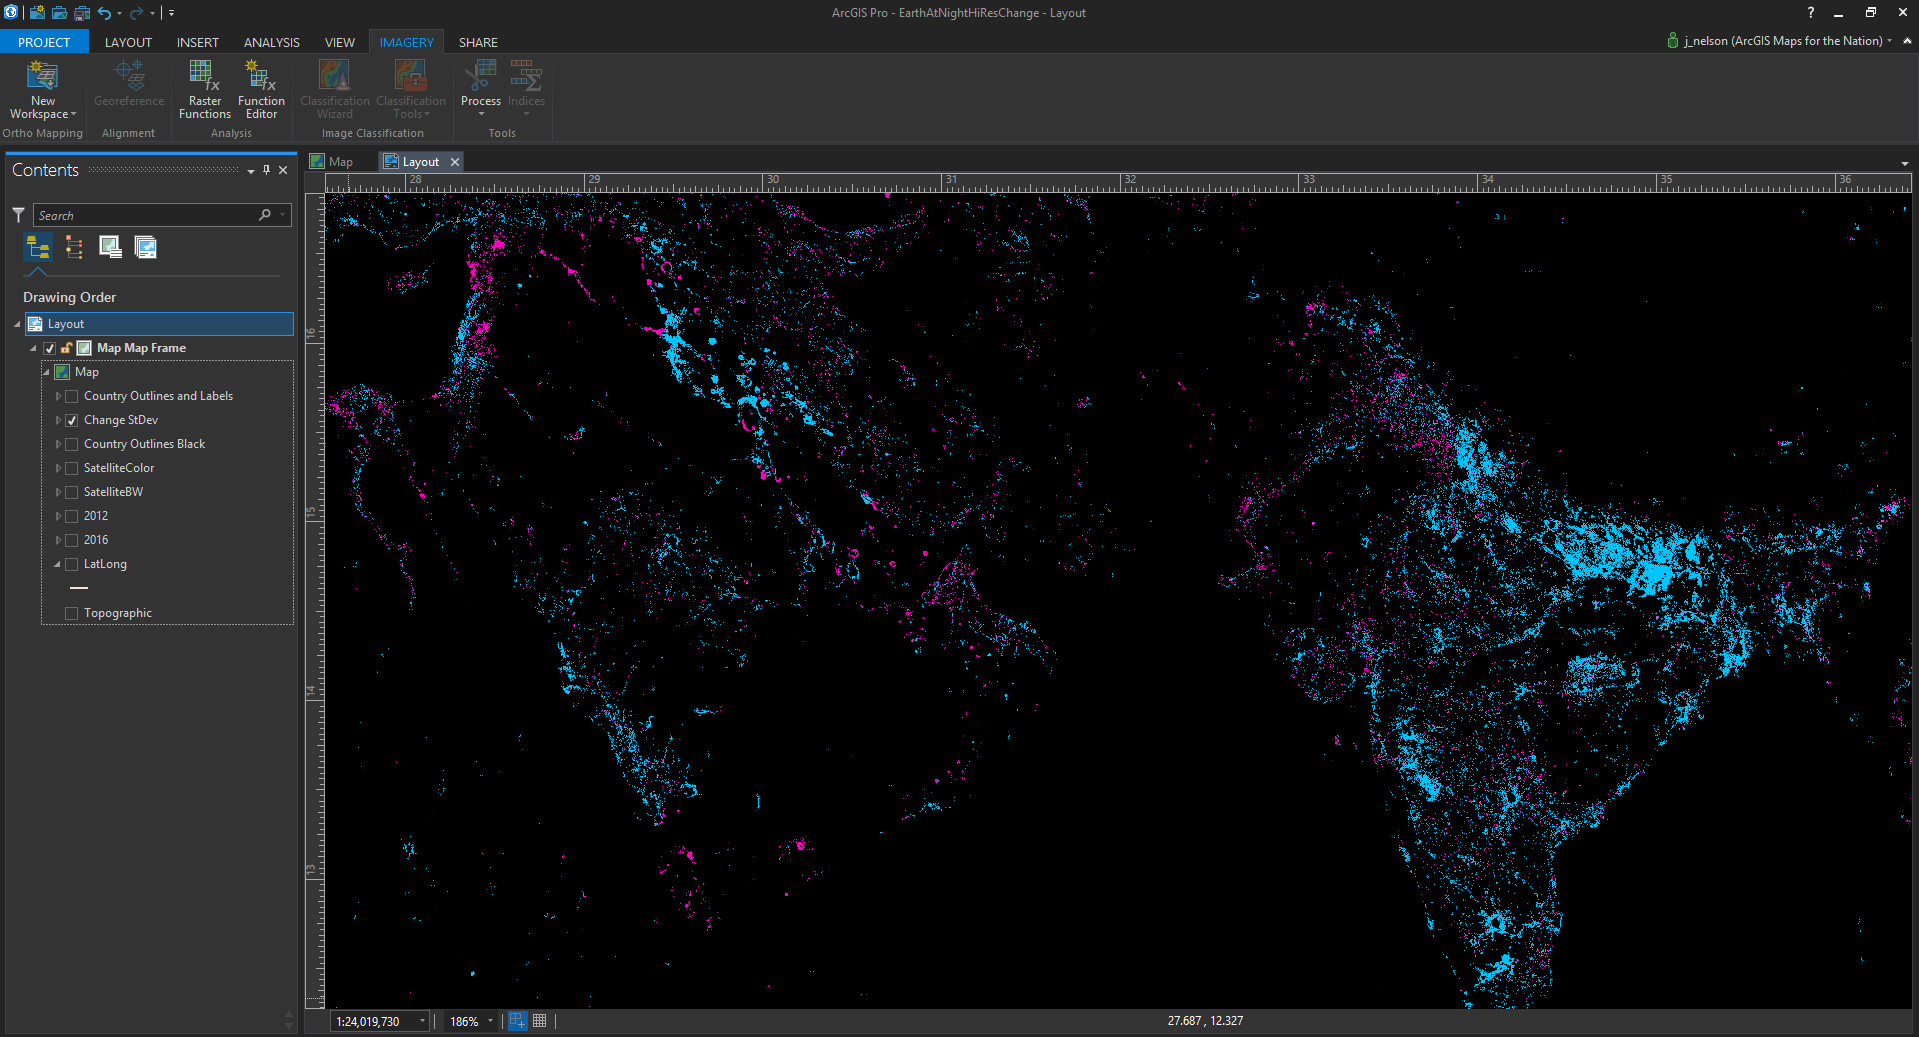
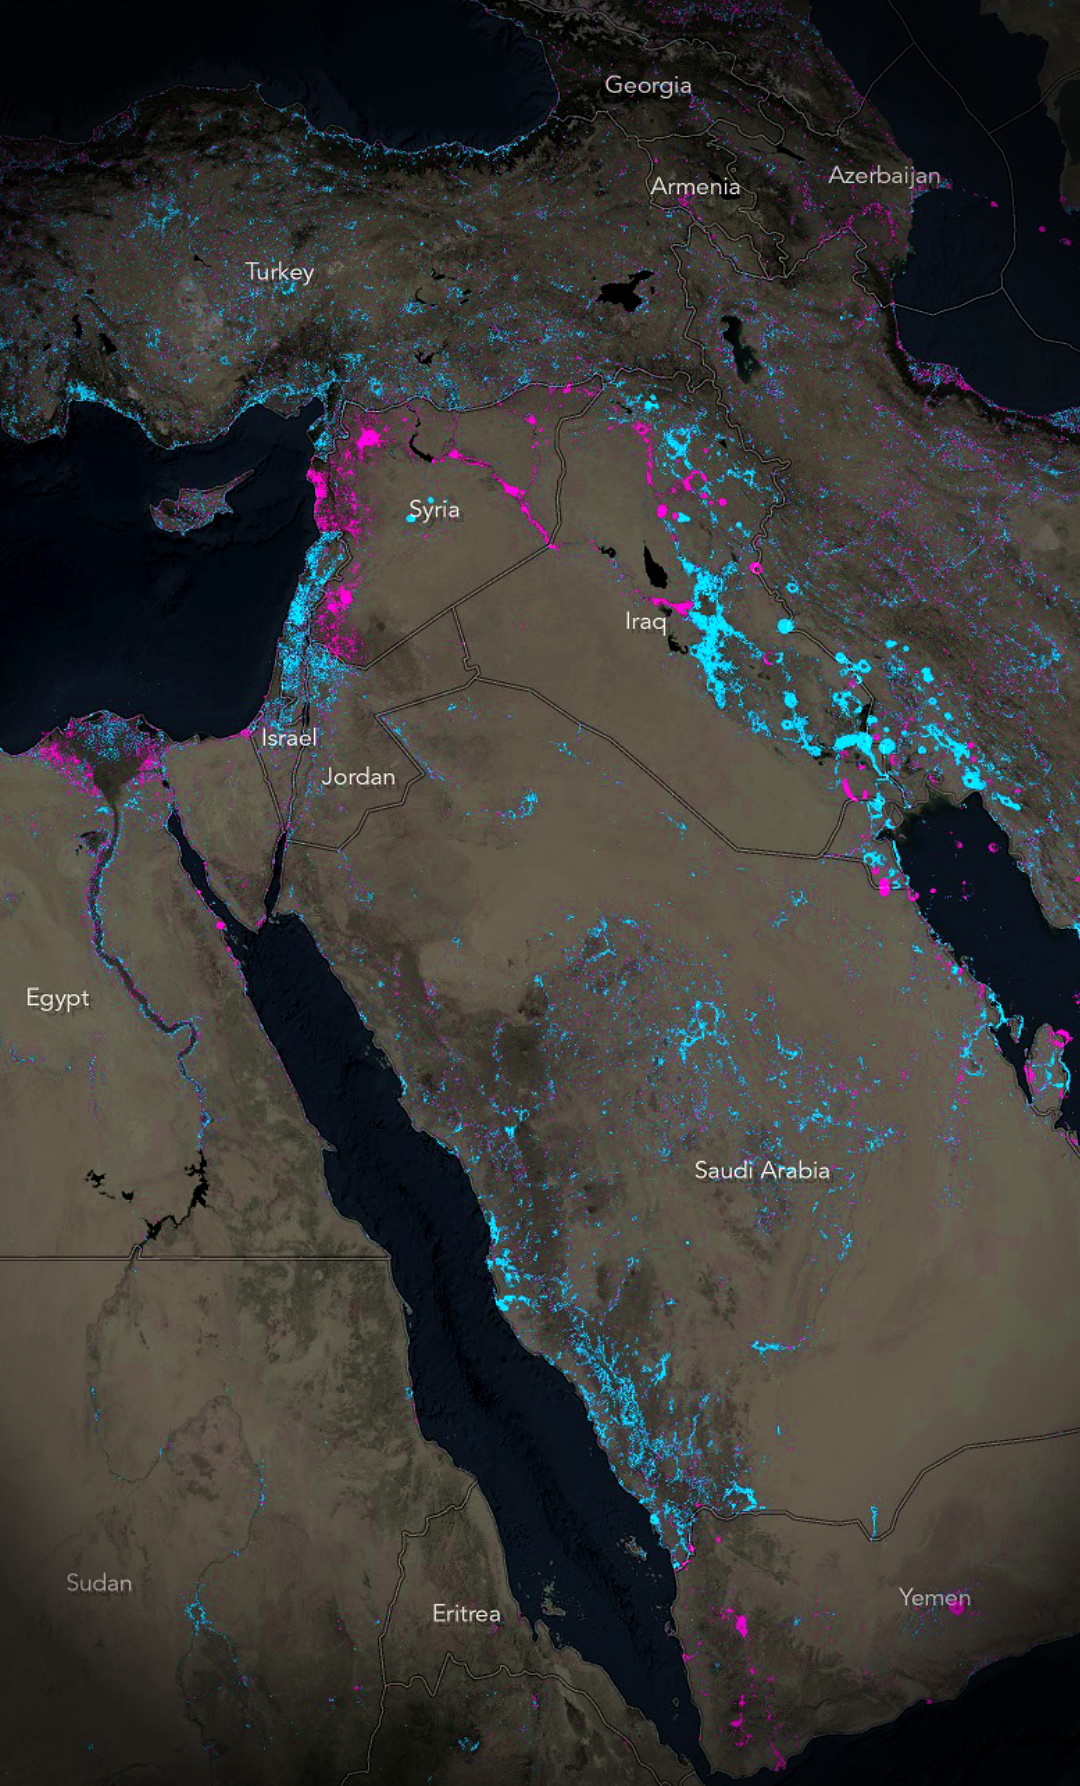
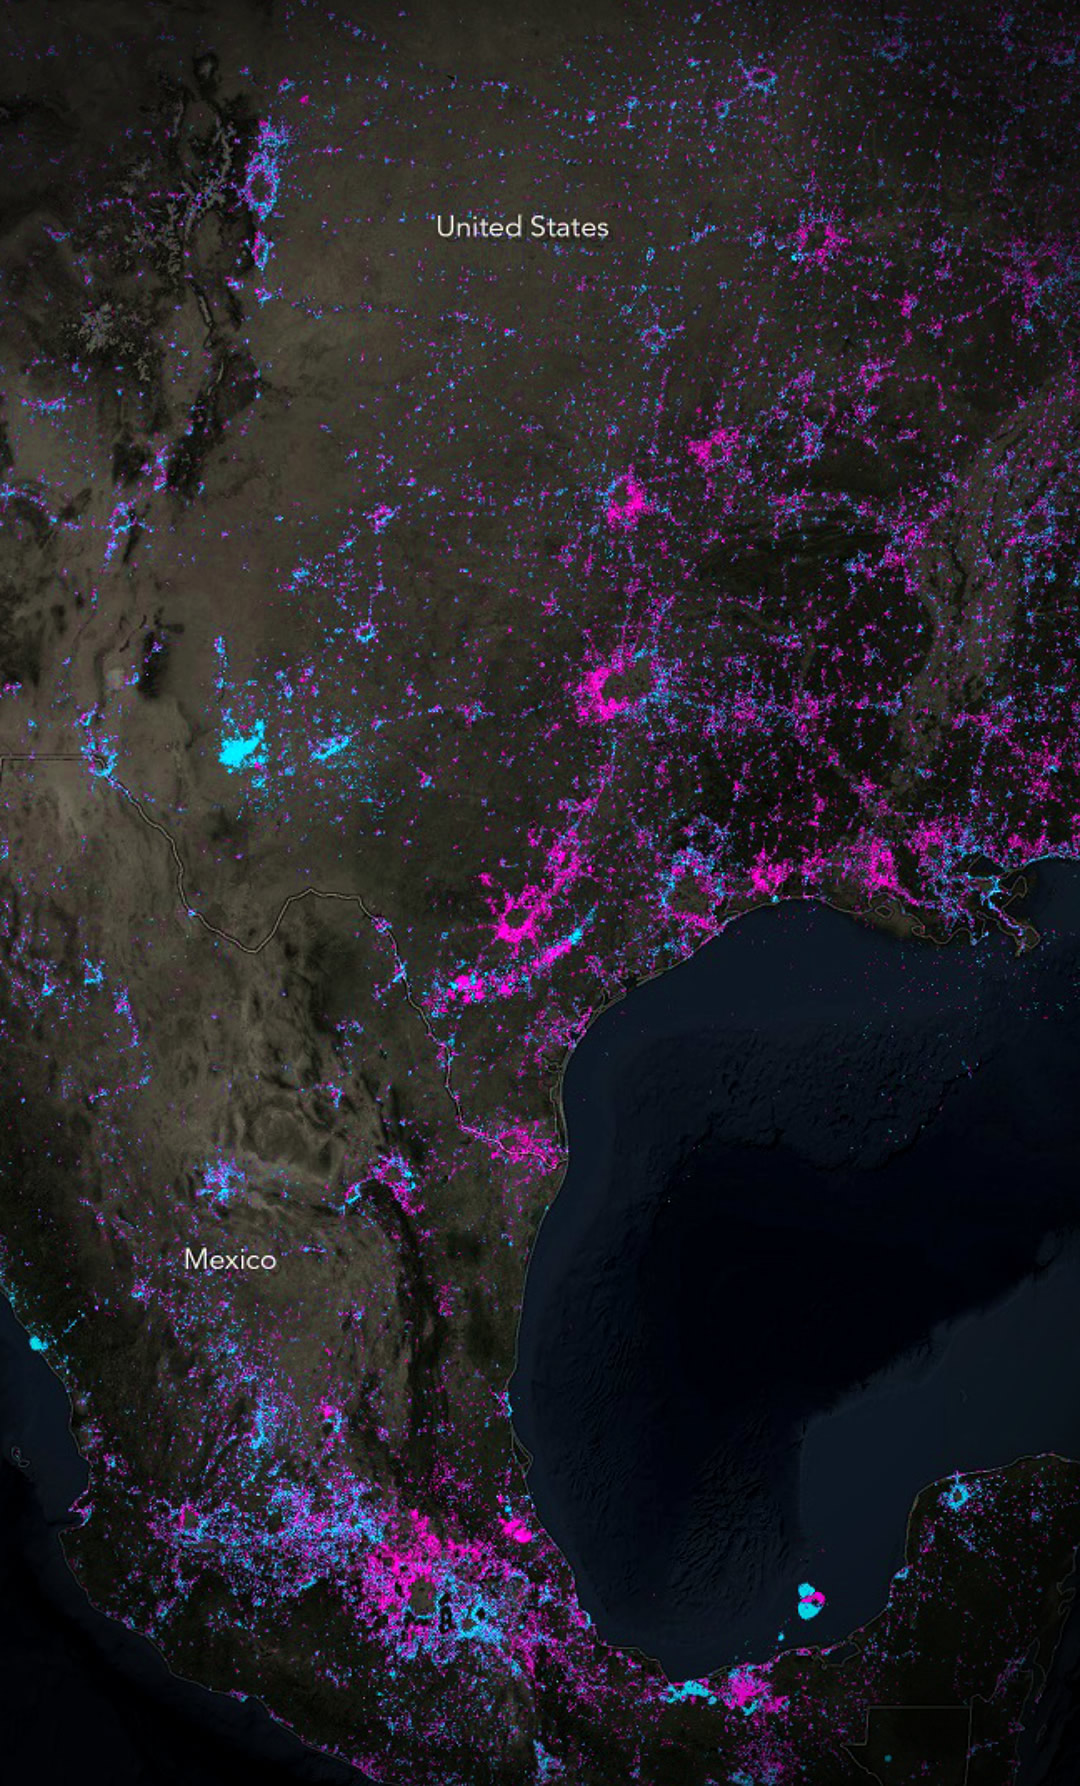
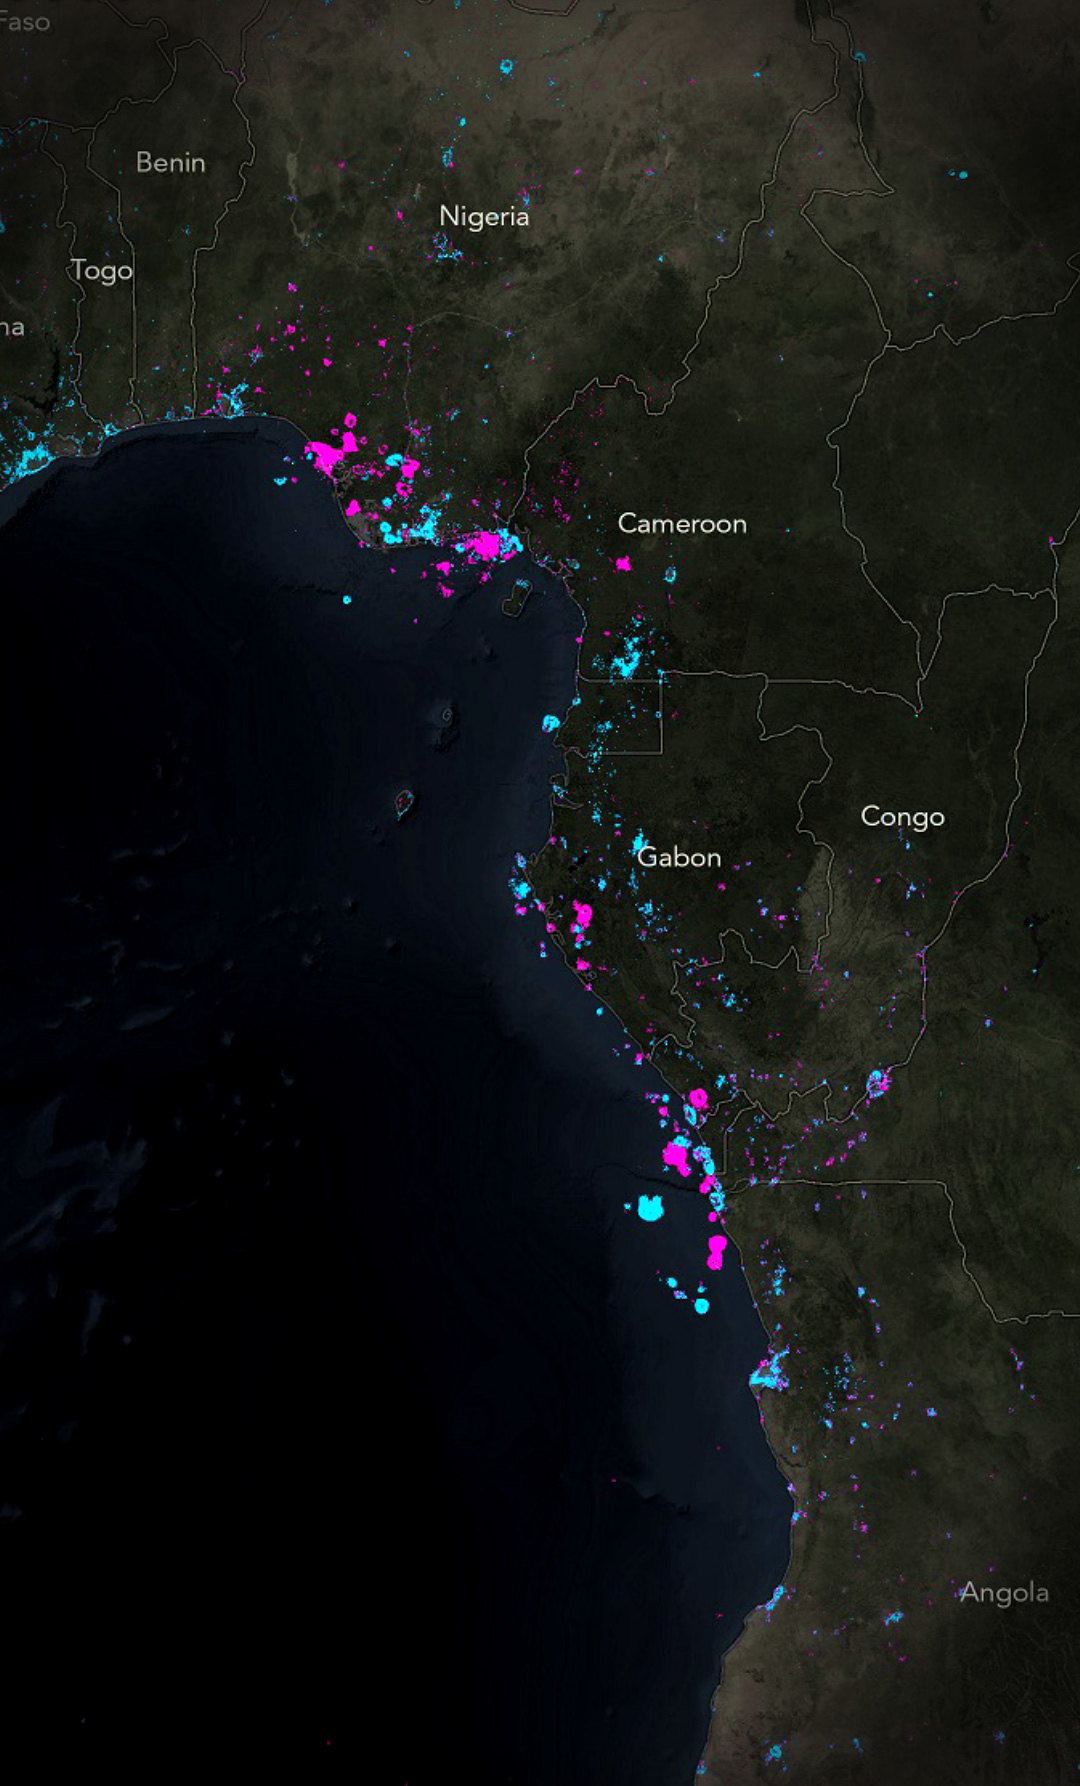
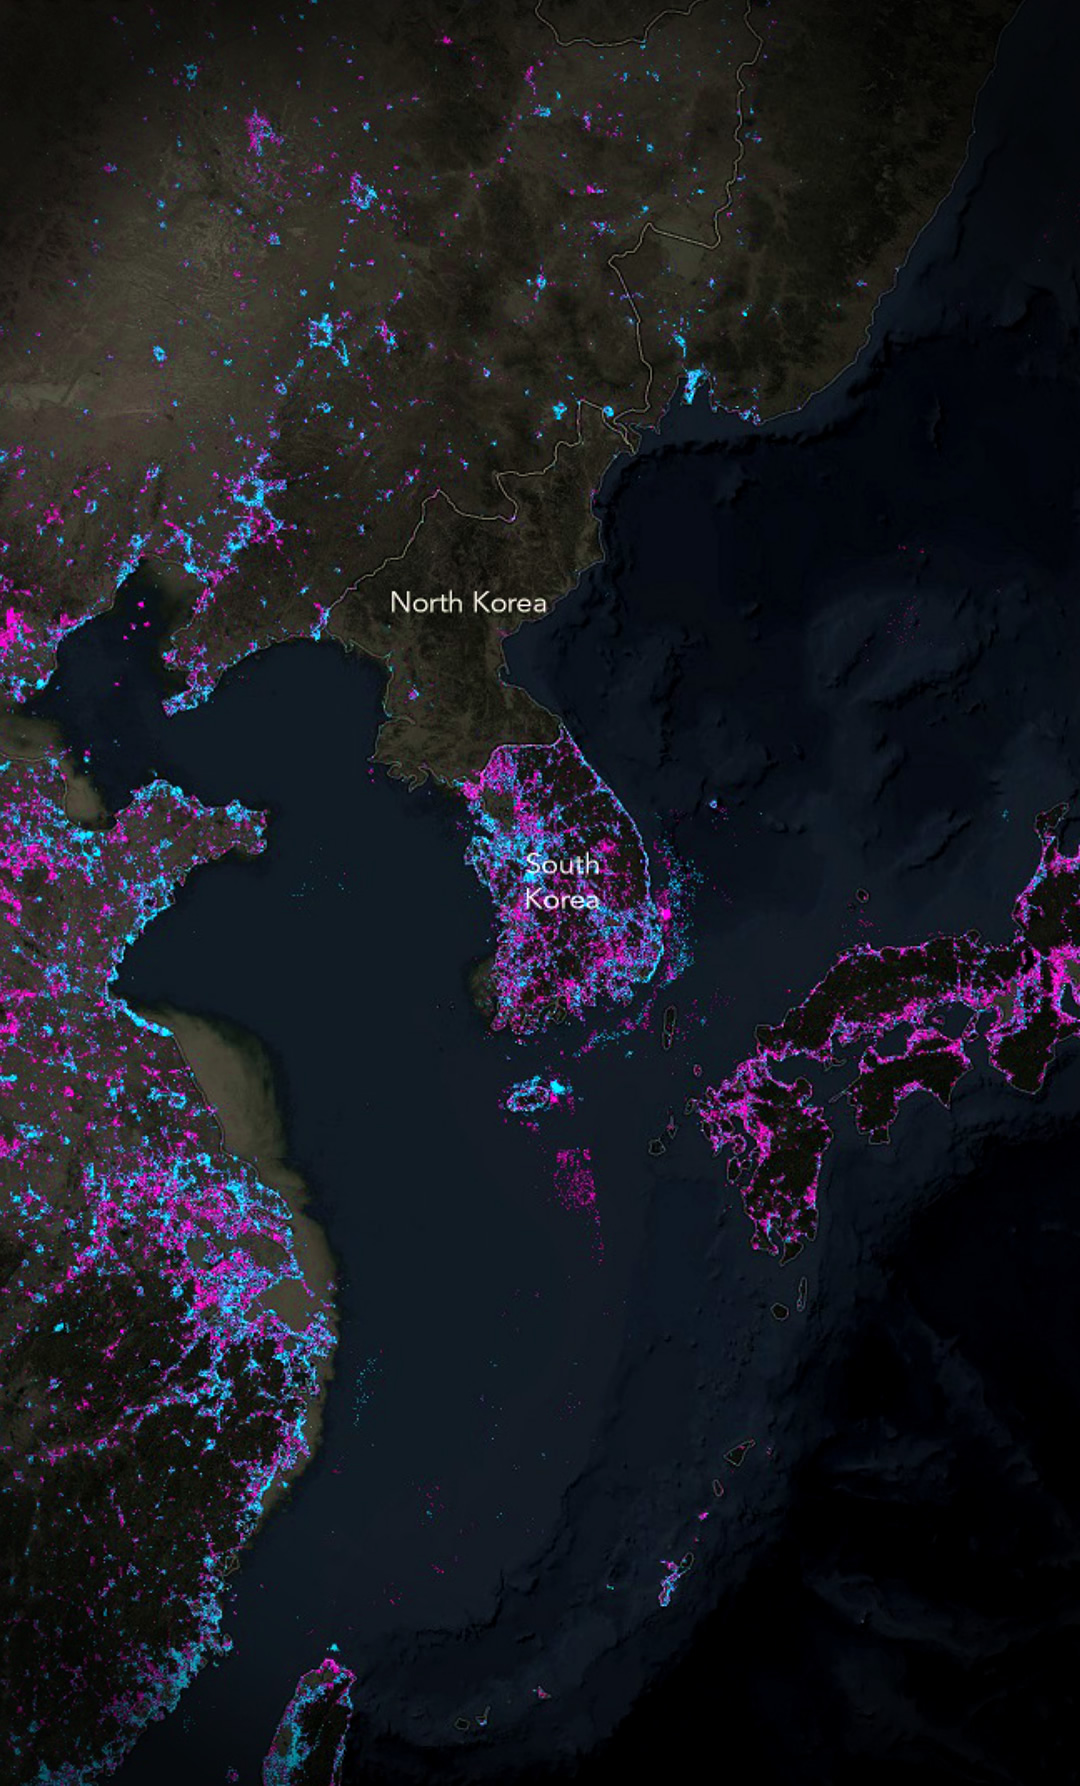
Fun! Definitely some patterns emerging of reduced nighttime illumination (magenta) in some places and increased nighttime illumination (blue) in others. But it’s lacking some context, so here it is with some muted Firefly-esque background imagery, country borders, and labels. Here is a head start on getting a dramatic basemap rolling for Firefly cartography in ArcGIS Pro.
Which, after adding a Title (which doubles as a legend) and vignettes in ArGIS Pro’s layout, you get this guy…
Next Steps
So now what? Since we want to promote the good work of mapping organizations, I’ll get going on nominating the Earth At Night imagery (and the derived change map) to the Living Atlas of the World, so more folks can find it and start playing with it in their GIS.
So I hope you try out some of the raster functions available in Pro, and I hope you consider nominating your own work to the Living Atlas.
Some Detail Snapshots, If You Feel Like Scrolling

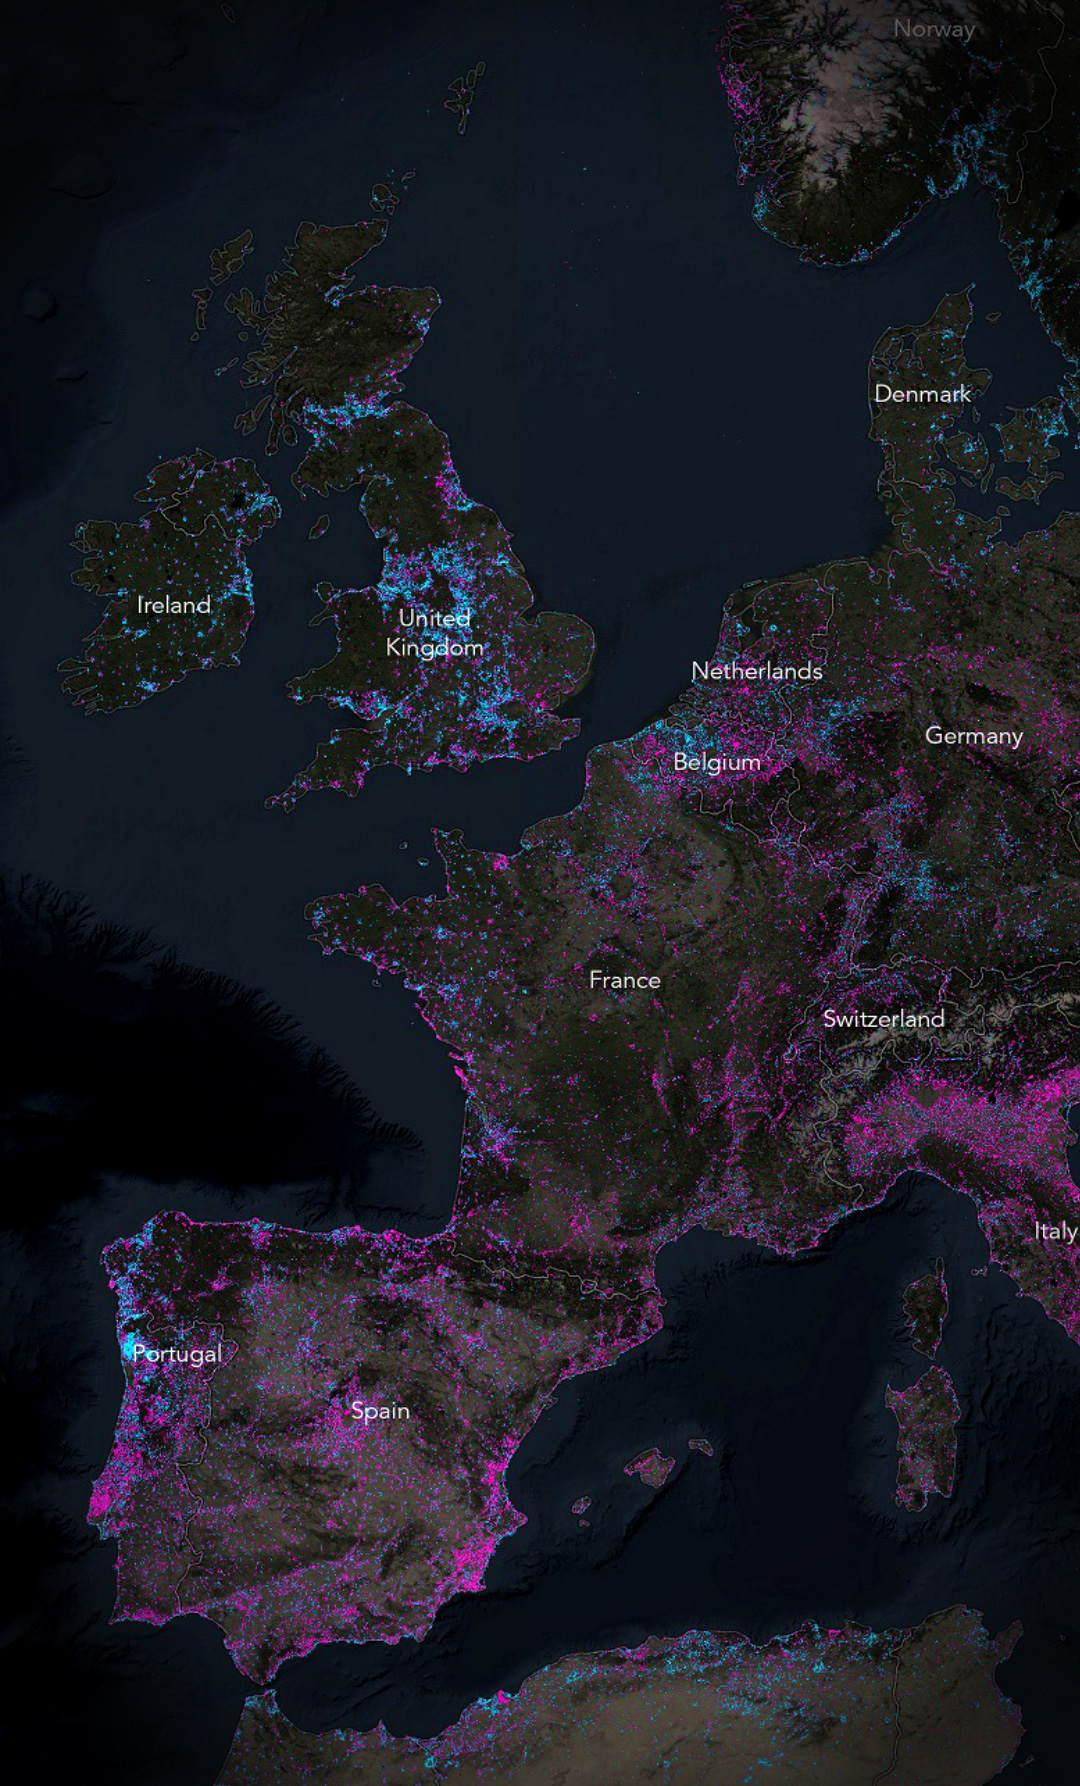
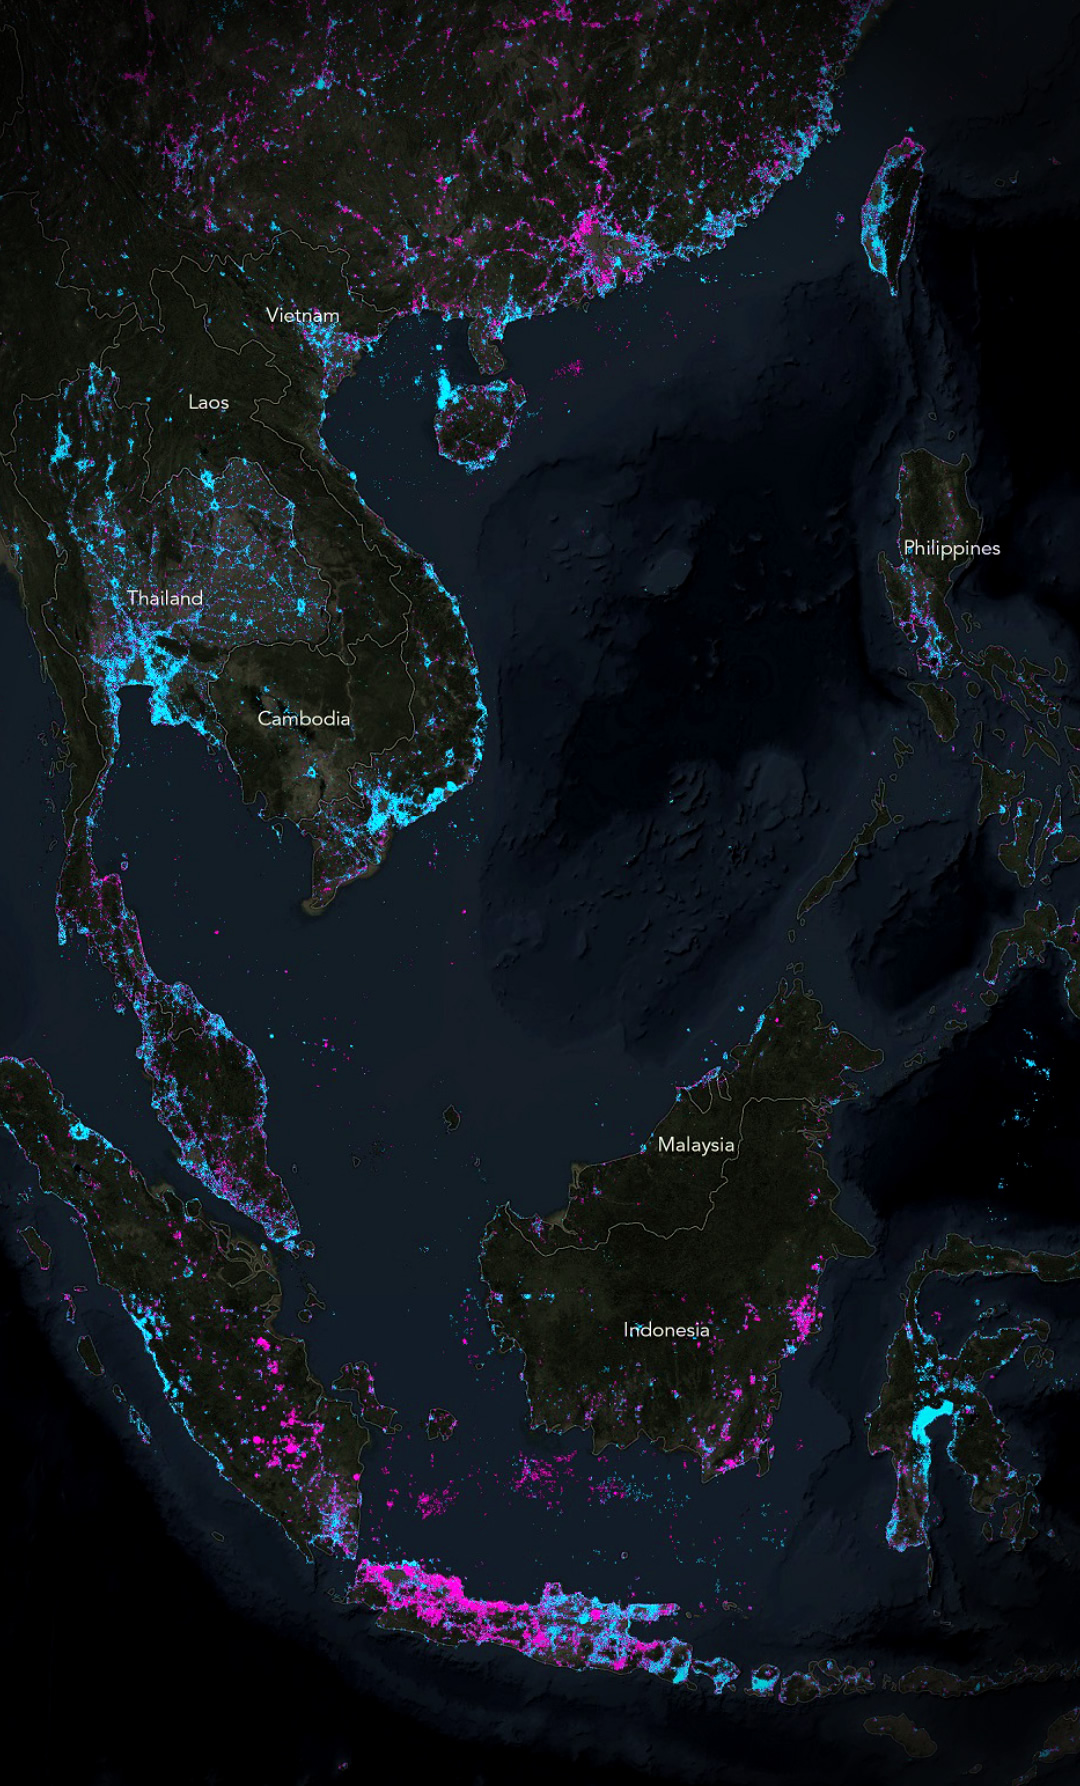
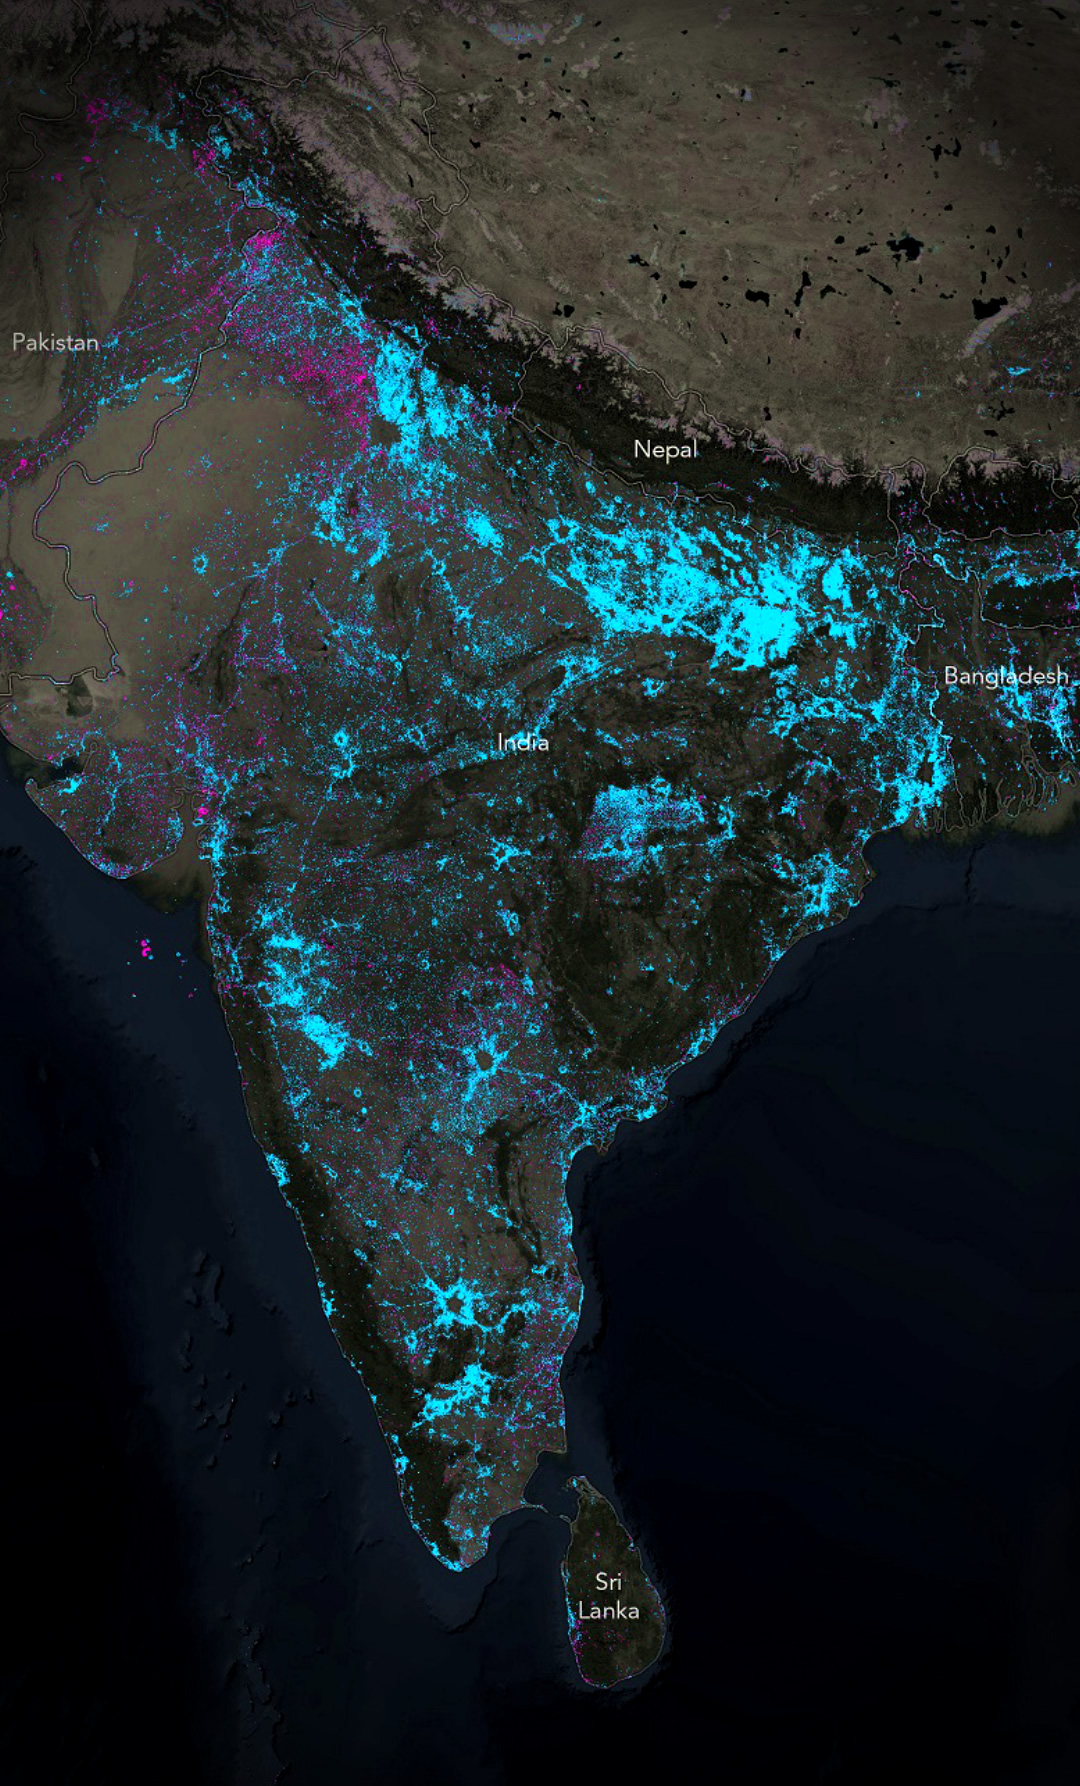
Happy Mapping! John


Commenting is not enabled for this article.