By Aileen Buckley, PhD, Esri Research Cartographer
In 2008, I wrote a blog post about how to make and symbolize an aspect-slope map. This type of map simultaneously displays the aspect (direction) and slope (steepness) of a continuous surface (figure 1), such as terrain represented in a digital elevation model (DEM). In these maps, colors represent different aspect classes and simulate relief shading, which gives a three-dimensional impression of the terrain in a natural, aesthetic, and intuitive manner. Light colors (such as yellow) on northwest-facing slopes and dark colors (like blue) on southeasterly slopes give the impression of illumination from an imaginary light source at the upper left corner of the map. This produces a pattern of light and shadows that allows us to better see the form of the underlying terrain surface.
The original workflow has since been greatly streamlined when you use the new aspect-slope raster function available for downloaded from Esri’s GitHub repository for raster functions. This function makes it much faster and easier to create an aspect-slope map from raster elevation data, and it does not require a new output dataset to be created (although you can save the raster layer file if you want). With the new aspect-slope raster function, the data is processed and displayed all in one step. The function currently works with ArcGIS Desktop and ArcGIS for Server (called ArcGIS Enterprise in version 10.5).
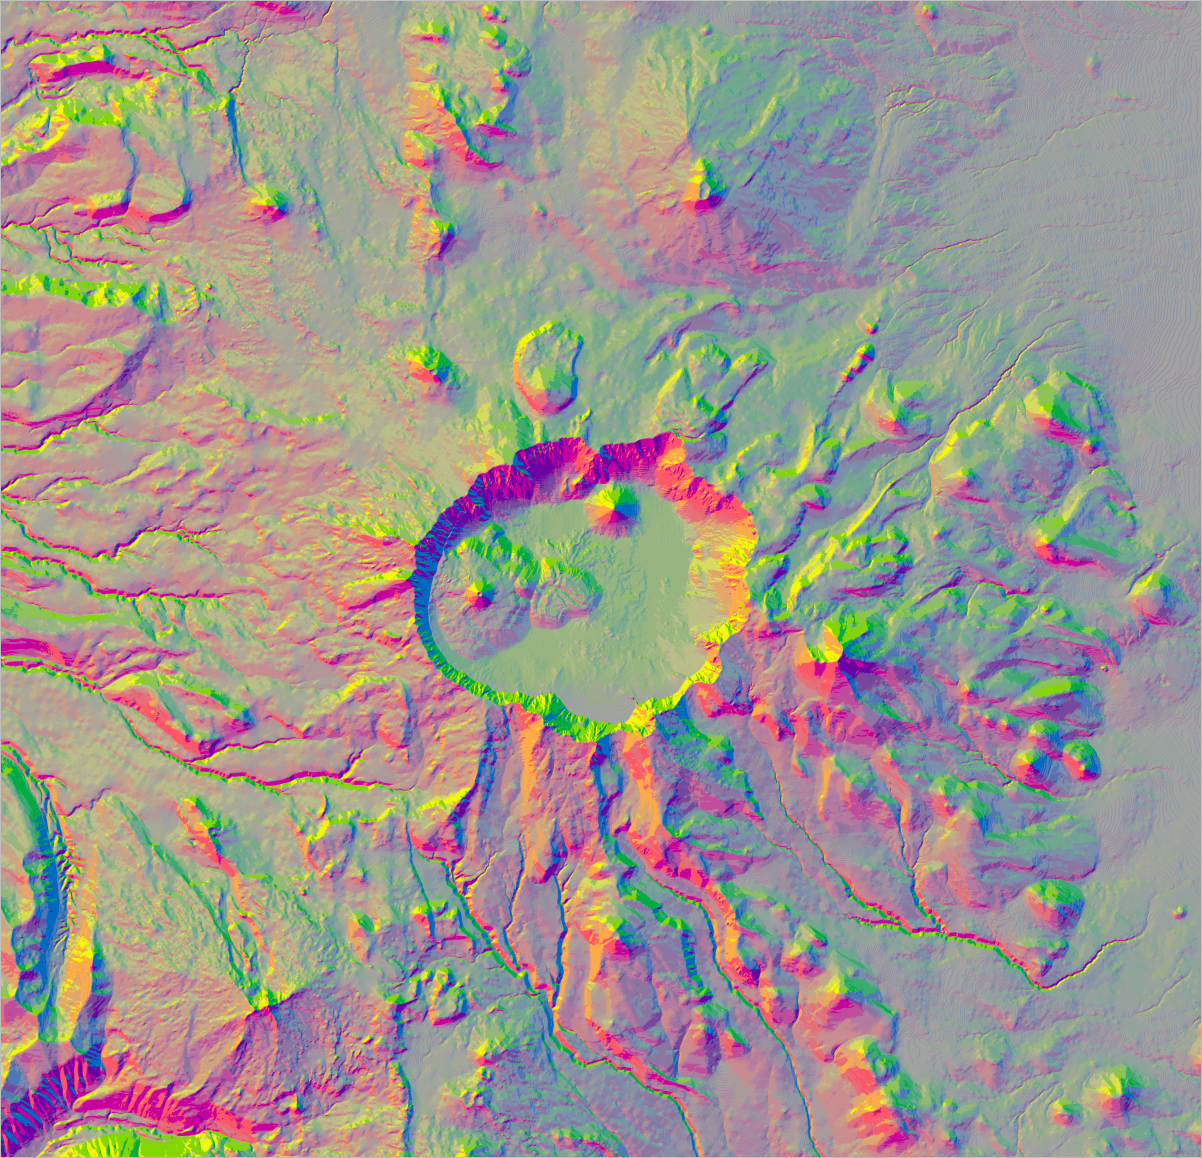
Figure 1. The aspect-slope map of the Crater Lake area in Oregon, USA
The aspect-slope raster function generates a map that categorizes aspect (surface direction) into eight classes that are symbolized using an orderly progression of color hues (what we normally think of simply as color, such as red, orange, and yellow) and slope (steepness) into three classes that are shown using color saturation (brilliance of color). Flat and near-flat areas are shown in gray. The aspect-slope map legend in figure 2 illustrates these colors.
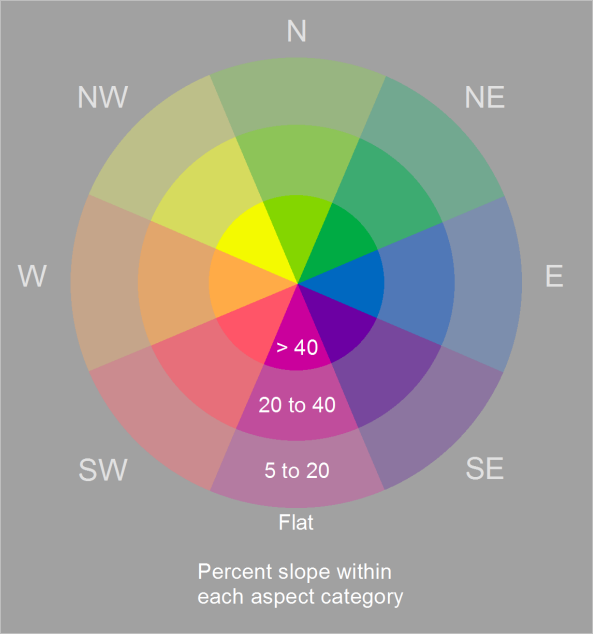
Figure 2. Aspect-slope map legend
The coloring is based on the Hal Moellering and Jon Kimerling MKS-ASPECT scheme described in a 1990 Cartography and Geographic Information Systems article (see the references below). With this scheme, the color hues, while remaining visually distinct, are arranged to simulate relief shading (a three-dimensional appearance) because northwesterly-facing slopes appear to be more illuminated (lighter in color) than the southeasterly slopes are. In an article from the AutoCarto 11 Symposia proceedings, Cynthia Brewer and Ken Marlow modified the MKS-ASPECT scheme by adding three slope classes and using color lightness in both the aspect and slope progressions to further enhance the perception of relief shading, which is crucial for visualizing the form of a continuous terrain surface.
This excellent choice of colors might be more obvious to you on the map of Crater Lake than in the legend. In figure 3, notice that the conically-shaped cinder cones (inside the flat area of Crater Lake) are shown with the same aspect colors as in the legend, and the brightest colors are used because these cinder cones have steep slopes. If you squint, you should also be able to see a 3D effect that accentuates the cinder cones’ shape and makes them appear higher than the flatter area around them. The northwestern interior escarpment of the large crater that forms the lake basin also appears as though it is in shadow, while the southeastern interior escarpment appears illuminated.
Figure 3. Craters, escarpments, and other landscape features shown with the aspect-slope colors
Try it yourself!
Here is a link to the Aspect-slope Python raster function documentation for creating an aspect-slope map in ArcGIS Desktop and ArcGIS Server. These instructions also contain a workaround for using an aspect-slope map in ArcGIS Pro.
If you want to try this out for yourself, download the Aspect-Slope_Map.zip file, which provides the aspect-slope raster function and a map document for the map shown in figure 4. The map document also contains a data frame with the aspect-slope map legend. The polygons used to make the legend are in the file geodatabase that is included in the download. The colors used for the legend are in the style file that is included in the download. You can use these resources to make the aspect-slope legend for your own maps.

Figure 4. The aspect-slope map that you can download to try out this workflow
Try this out today!
For additional details about aspect and slope, the aspect-slope color scheme, DEM data, and raster functions, read on!
About aspect and slope
According to Map Use: Reading, Analysis, Interpretation, Eighth Edition, aspect can be defined as “the downslope direction of the maximum vertical change in the surface determined over a given horizontal distance.” Think of this as the direction that the surface is facing. Slope is “the vertical change in the elevation of the land surface (rise), determined over a given horizontal distance (run).” You can also think of this as the amount of steepness (or the rise or fall) of the ground surface. Aspect maps, slope maps, and aspect-slope maps are usually made with raster data that represents an elevation surface (that is, a DEM, as in figure 5), but they can also be made for continuous surfaces of other data, such as population density or other statistics.
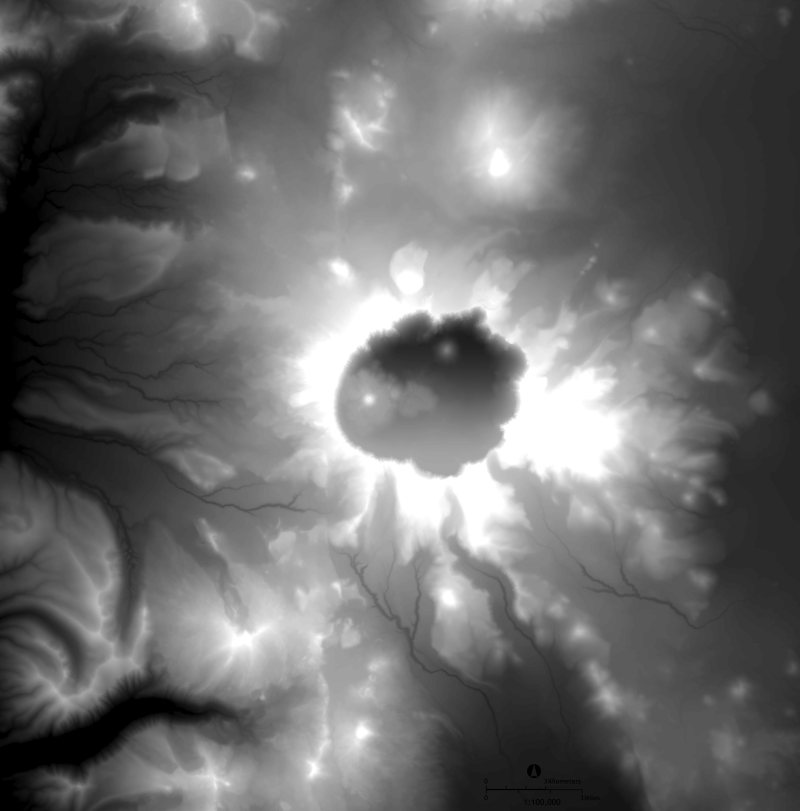
Figure 5. A DEM for the Crater Lake area
About the aspect-slope color scheme
The cell values in the aspect-slope raster reflect a combination of aspect and slope. The cells have values that range from 11 to 48. Cells with values below 21 are flat and shown in gray. Other cells have values ranging from 21 to 48, as shown in figure 6.
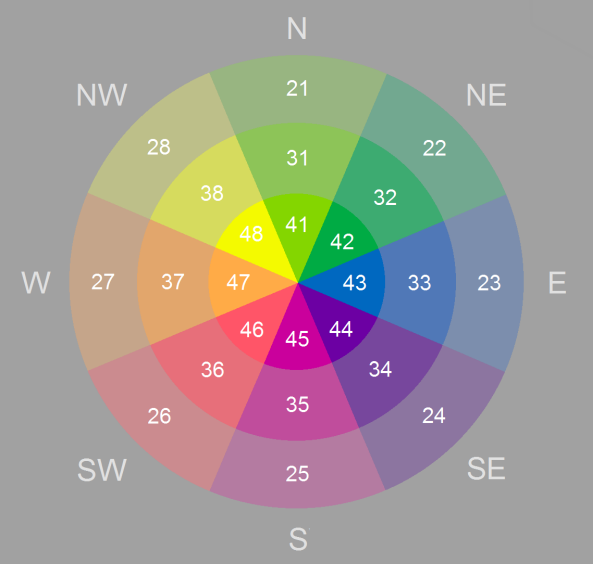
Figure 6. Cell values and their corresponding colors on the aspect-slope map
Cells with values in the 20s have lower slopes (from 5% to 20%), values in the 30s have higher slopes (from 20% to 40%), and values in the 40s have the highest slopes (greater than 40%). Cells with values that end in 1 have north-facing slopes, values that end in 2 have northeast-facing slopes, and so on.
About DEM data
You no longer have to find DEM data on your own, because Esri has created a multiscale terrain dataset for the world that can be accessed from ArcGIS Online. This layer provides data as floating-point elevation values suitable for use in analysis and with raster functions. The ground heights are based on multiple sources, and numeric values represent ground surface heights based on a digital terrain model (DTM).
To add this layer in ArcMap, choose the Add Data From ArcGIS Online option and search for Terrain (figure 6). (Note: In ArcGIS Pro, on the Portal tab of the Project pane, add data from the Living Atlas of the World and select Terrain.)
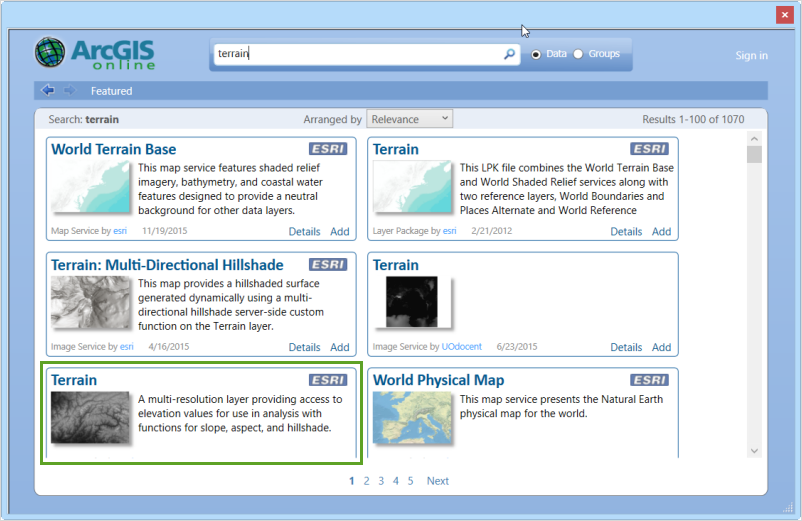
Figure 7. Adding the Terrain layer in ArcMap
About raster functions
Raster functions are used with image and raster data to process and display the data. With raster functions, this processing is not permanently applied to the data—instead, it is applied on the fly as the images or rasters are accessed. This is similar to creating a layer file and defining the symbology for a raster dataset, such as defining a color ramp to be used with a DEM. The difference is that you have to save the layer file as a separate file, but you do not have to save the result after you apply a raster function. If you save and open the map document again, the raster function will still be applied (provided you have not moved it from its original file location).
If you want to save the results as a stand-alone layer that can be added to other maps or shared with others, you will need to save the raster with functions in ArcMap. To do that, you can use any of the following options:
- Export the raster to an existing mosaic dataset
- Save the raster layer file
- Export the raster to any of the supported raster dataset file formats, such as an Esri Grid, so that the functions will be permanently applied
As an aside, in working with this new raster function, I came to realize that the colors in the original blog post were wrong (they were “preliminary colors in use before the map was exported to the Macintosh environment for color-scheme work in HVC”—Hue, Value, Chroma—as noted in the Brewer article). These have been corrected in the original blog post, and they are also correct in the new aspect-slope raster function.
References
- Brewer, Cynthia A., and Ken A. Marlow. 1993. “Color Representation of Aspect and Slope Simultaneously,” Proceedings of the AutoCarto 11 Symposia, Baltimore, Maryland, October 30–November 1. Available online at http://mapcontext.com/autocarto/proceedings/auto-carto-11/pdf/color-representation-of-aspect-and-slope-simultaneously.pdf and at http://www.personal.psu.edu/cab38/Terrain/AutoCarto.html.
- Moellering, H., and A. J. Kimerling. 1990. “A New Digital Slope-Aspect Display Process,” Cartography and Geographic Information Systems, 17(2): 151–159.
Thanks to our colleagues at the Esri R&D Center, Sharjah—Abhijit Doshi, technical manager, raster solutions; Cristelle D’Souza, product engineer; and Angad Kundra, student at BITS Pilani Dubai Campus—for creating the aspect-slope raster function and making it available to everyone!


Article Discussion: