Both the GIS and entertainment industry carry the power to shine light on social issues. Geographic Information Systems provide understanding by shedding light on specific areas that suffer from multiple, highly interrelated spatial challenges, while the entertainment industry guides and highlights the current attention patterns of the broader community. When these two forces combine, potentially positive impacts become effectively limitless. Which is why, this month, Esri contributed its spatial expertise to the #WHERESTHELOVE campaign, in close collaboration with the Black Eyed Peas and the i.am.angel Foundation.

Esri recently revealed a Story Map that draws attention to U.S. neighborhoods that are struggling due to low spending on education, high unemployment, high poverty and high crime rates.

At will.i.am’s request, maps found within the Story Map create context for communities in crisis such as Baltimore, Maryland; Baton Rouge, Louisiana; Ferguson, Missouri; St. Paul, Minnesota; New York City and Sanford/Orlando, Florida.
For any city, town or rural area in the U.S., viewers can explore spending per pupil, educational attainment, students in poverty, prison populations and murder index.

Although many cities exhibit similar patterns of high crime in areas of low educational attainment, low education spending and high poverty, Esri does not imply causation between these variables. Esri has made the data available for anyone interested in conducting their own analysis. Many researchers use spatial analysis to understand what interventions are needed and where.
To create this Story Map, Esri assembled data from the Sentencing Project, the Bureau of Justice Statistics, the National Association of State Budget Officers, the U.S. Census Bureau, and Esri’s Living Atlas of the World.
In addition to the Story Map, Esri also provided a map for the wheresthelove.com webpage. At this site, viewers can watch the new Where’s the Love video, find opportunities to donate and compare incarceration and education spending by exploring the map.
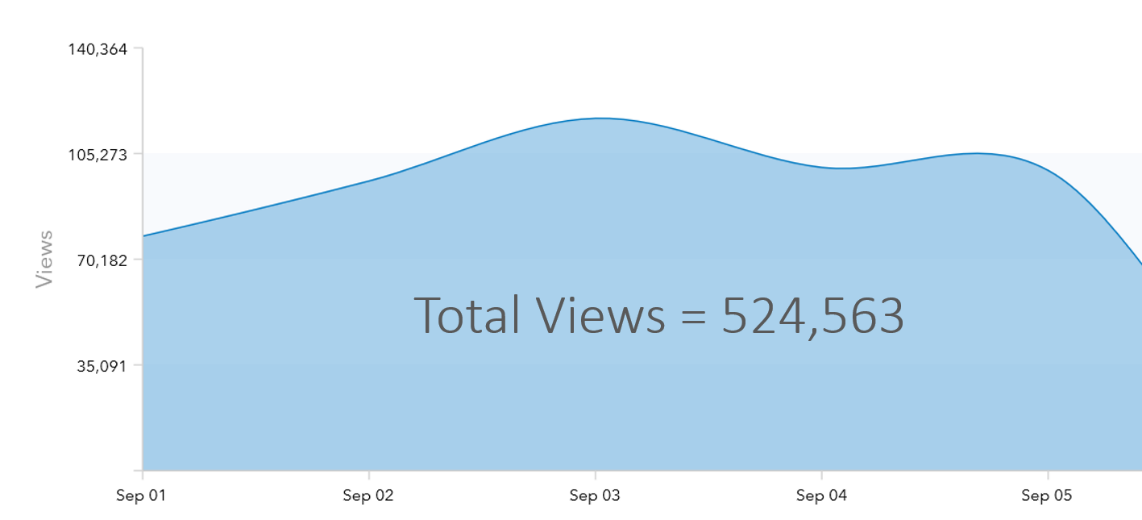
In just 5 days after the campaign’s release, there have been over 500,000 map views with an average of around 100,000 views per day.

Thanks to Colten Zacharias for contributions to this post.

Article Discussion: