Note: This blog article covers the classic Esri Story Maps which are in mature support and scheduled to be retired in late 2025. Story authors are strongly encouraged to use the new ArcGIS StoryMaps to create stories.
For more information about transitioning to the new StoryMaps, see ArcGIS StoryMaps resources. For more information about the transition from classic Esri Story Maps to the new ArcGIS StoryMaps, see Esri Story Maps: Now in mature support.

A popular story map is Story Map Tour, used for Palm Springs Map Tour, San Diego Mission Bay Reserve, and many other interesting stories. This app is ideal when you want to present a linear, place-based narrative featuring images or videos. Each stop in the narrative is geo-located. Viewers have the option of clicking sequentially through the narrative, or they can browse by interacting with the map or using the thumbnail carousel.
One of the ways you can build a Map Tour is by using a spreadsheet (CSV file) with the locations of the photos you want to use, the title and description of each tour stop, and more. Using a spreadsheet is ideal when you want to collaborate with others, check spelling, and make modifications. Here’s an example of using a CSV file to build a Story Map Tour.
*
The project
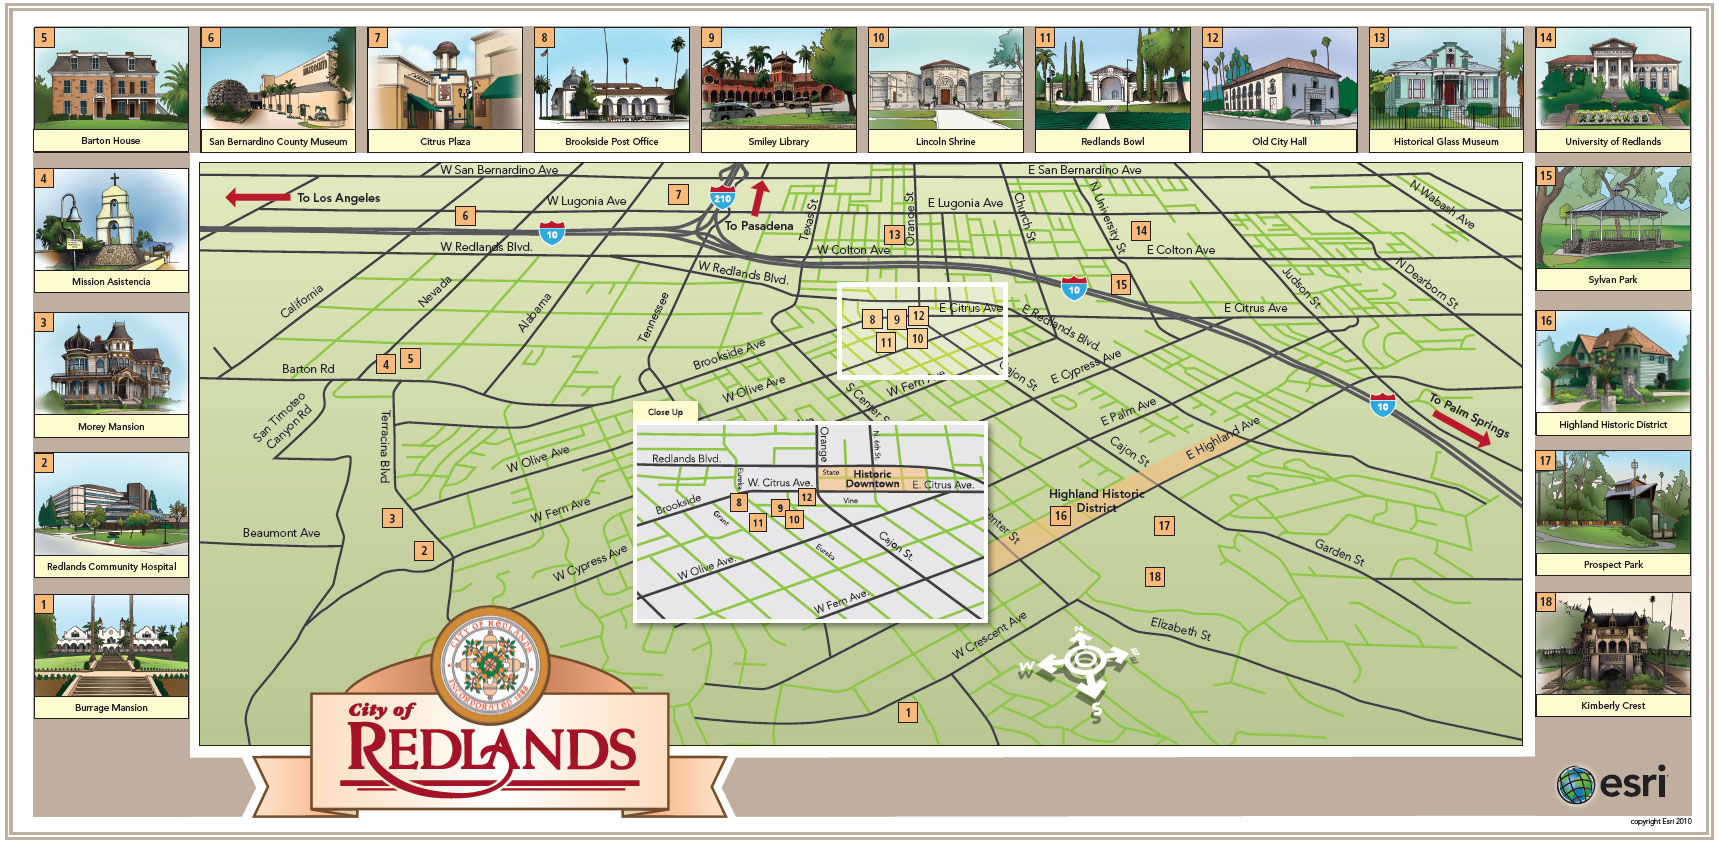
For this project we wanted to create an interactive Story Map version of a printed map included in a visitors guide published by the local newspaper, the Redlands Daily Facts. You might find copies of the guide in the visitor’s lounge in Esri’s reception area, and elsewhere around town. Here’s the printed map:
Here is the Map Tour:

*
The steps
To create the map tour using a CSV file, we followed a few simple steps outlined below. To successfully publish your own Story Map Tour you’ll need to login to your ArcGIS Online account, and must have hosted the the photos you will use on a publicly accessible server, social media site, or in your ArcGIS account.
Step 1 – Open the Story Map Tour builder
Go to the Story Maps website, sign in to your account, and click the Apps tab to view the App List.

Locate Story Map Tour, and launch the Map Tour builder by clicking Build.

Step 2 – Download the CSV file template
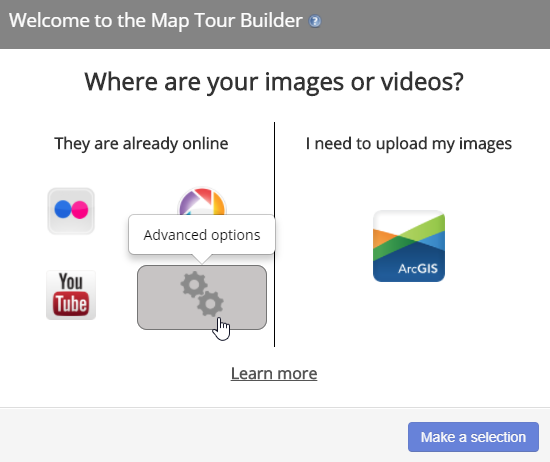
Click Advanced options (the gears graphic):
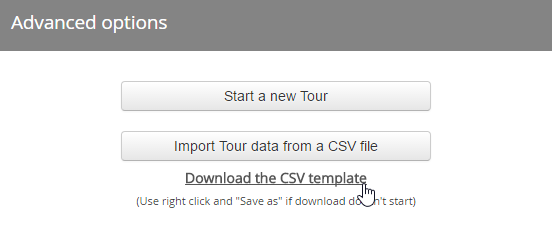
Then click Download the CSV template:
Once you’ve downloaded the CSV template, you can quit the Map Tour builder without saving. We’ll edit the CSV file and import it later.
Step 3 – Prepare and host your photos
For each location on your map, you’ll need two versions of the same photograph or image. One is a thumbnail that is displayed in the thumbnail gallery, and the other is a larger version that displays in the frame for the selected location.

The size of the photos will have an impact on the performance of the application, so keep these to a minimum. For best results we recommend a size of roughly 1000 x 750 pixels for the larger version of each photo, and size of 120 x 90 pixels for the thumbnails (both at 72 DPI). Your photos don’t need to have these exact dimensions; photos and thumbnails that are different in size or aspect ratio will be fit into the application.
Once you’ve edited your photo pairs, upload them to your public web location so they can be referenced in the application via their URL. For example, below are the URLs for one of the photos and its corresponding thumbnail used in our application:
http://downloads2.esri.com/agol/pub/redlandsguide/graphics/barton.jpg
http://downloads2.esri.com/agol/pub/redlandsguide/graphics/barton-thumb.jpg
Step 4 – Edit the downloaded CSV template
Edit the CSV file downloaded in Step 2 (it is named Locations.csv) and replace it with your data. You can use Notepad or any other text editor to make the necessary changes. The field names must remain the same, though they are not case-sensitive. Order is not important, and you can have additional fields.
Field names and contents are:
- name – the caption for the photo, and the text that will appear under each thumbnail. The name can include multiple words, and will wrap to a second line if necessary.
- description – A short description of the photo. This should be kept to a single sentence, or a couple of short sentences. Enclose the description in quotes if it includes commas or other punctuation.
- icon_color – The color of the icon that will be placed on the map at the photo location. Currently R (red) and B (blue) are supported.
- long – Longitude (X) coordinate in decimal degrees.
- lat – Latitude (Y) coordinate in decimal degress.
- pic_url – The publicly accessible URL location of the full-size photo.
- thumb_url – The publicly accessible URL location of the thumbnail photo.
- is_video – add Y to this field to indicate that pic_url contains a link to a video.
Tip #1: If your spreadsheet has addresses instead of lat/long, first add the CSV to a web map to geocode the locations, then share the map and Make A Web App, choosing Story Map Tour from the app gallery.
Tip #2: Any row in the CSV can be used to display an intro photo or image for your tour. The image it references will not be shown on the map, but can be used to present introductory information to the user. When using a CSV where one of the rows is to be used as the introduction, all fields for the row should be completed – the lat/long fields will ultimately be ignored, but must be present. Coordinates can be copied from another row in your file. See the Story Map Tour Tutorial for more information on configuring an introduction.
Step 5 – Build a Story Map Tour using your CSV
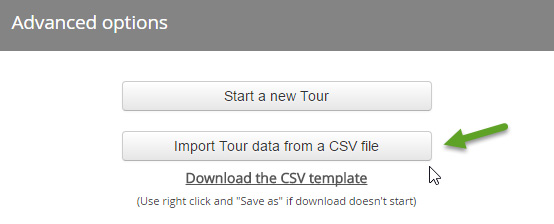
Once you’ve completed editing the CSV file, open the Story Map Tour builder and click Advanced options, as shown in Step 2. Click Import Tour data from a CSV file:
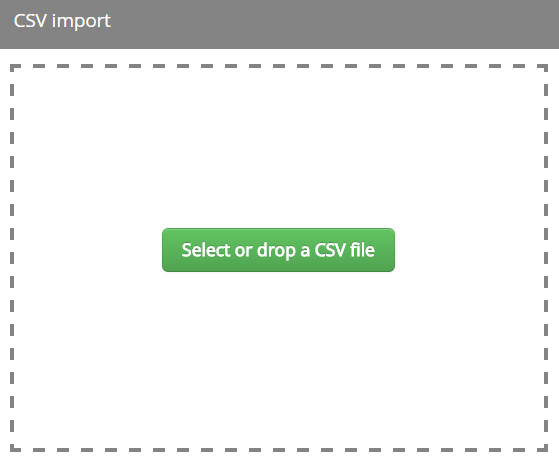
Then select your CSV file, or drag and drop it to create the Tour.
Complete the Tour by editing the title and subtitle, and making other changes as desired, then Save.
*
Summary
Using a CSV as the source for your Story Map Tour offers several advantages. All your edits and changes can be reviewed and completed before the story map is created, you can share your work with others for review, and edits and new story map versions can easily be made using an updated CSV.
*
More information
This post was originally published on March 1, 2013, and has been updated.


Commenting is not enabled for this article.