ArcGIS Pro is a 64-bit, multi-threaded application that takes advantage of modern computing architecture. That architecture is a big advantage for ArcGIS Pro, but it does make it a little harder to troubleshoot performance issues when they do occur. This article will discuss those issues and tools you can use to troubleshoot them.
Since ArcGIS Pro uses your GPU to accelerate rendering, the first thing a user with ArcGIS Pro should do is update their GPU driver directly from the manufacturer (e.g. NVidia, AMD or Intel). New driver releases not only fix bugs and increase stability, but also can give performance increases as well! Note that “manufacturer” means the GPU vendor in the case of a desktop computer, but if you’re using a notebook computer, then you’ll need to get your driver updates from the manufacturer of the notebook itself.
The performance problems you may experience in ArcGIS Pro have four main categories:
-
LOW/INCONSISTENT FRAMERATES: When you observe that the display feels “jerky” or unresponsive to navigation commands, it’s possible that you’re experiencing low or inconsistent framerates. Usually this is related to the volume of data that’s being loaded or displayed for a given view.
-
APPLICATION UI IS GREYED OUT: When the commands on the ribbon, context menus, or in your panes are greyed out, this means some part of the application has executed code which must return before the application can receive other inputs. This greys out portions of the UI.
-
OPERATIONS ON LAYERS IN YOUR WEB GIS ARE SLOW: When you’re working with Web GIS layers from on-premises/hosted Portal or ArcGIS Online, the map may seem to take a long time to load, or context menu options may seem to be greyed out for a long time. Usually this is related to network issues (congested or saturated network resources), or it could indicate that the server itself is operating at a high load.
-
A LAYER SEEMS TO REDRAW FREQUENTLY: When some layers seem to disappear and redraw almost constantly, or after each navigation. Usually this is a problem with the layer’s caching options – which are available in the layer properties dialog’s “Cache” tab. Try changing this option to the “Keep cache between sessions” option to resolve the issue, unless the caching option is chosen for a specific reason (e.g. layer is updated regularly).
The developers of ArcGIS Pro have built in some tools to help you troubleshoot performance issues and give a little more info to solve the problem. Below is more information about these tools, and some possible suggestions to try and work around the problems. If you’re still having trouble, or you think you’ve found a bug, don’t hesitate to report it to support@esri.com or by calling directly!
Diagnostic Tool: “drawing” indicator
When the graphics system is still loading data or properties to do the work of rendering, there is a “swirling” indicator displayed in the lower right corner of each view. When this is still moving, it means the graphics system is still accessing data needed to render the view. If it remains moving for a long time, it can indicate an excessive amount of loading is occurring, or that loading is taking a long time. This can indicate network congestion or scalability issues if you’re working with Web GIS layers coming from your on—premises, hosted or ArcGIS Online portal.
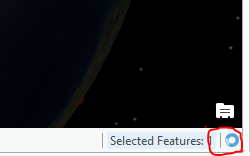
The drawing indicator shows when loading and drawing is still happening.
In more recent versions of ArcGIS Pro you’ll also see a pause button next to the drawing indicator.
Diagnostic tool: Performance readout/overlay on the view
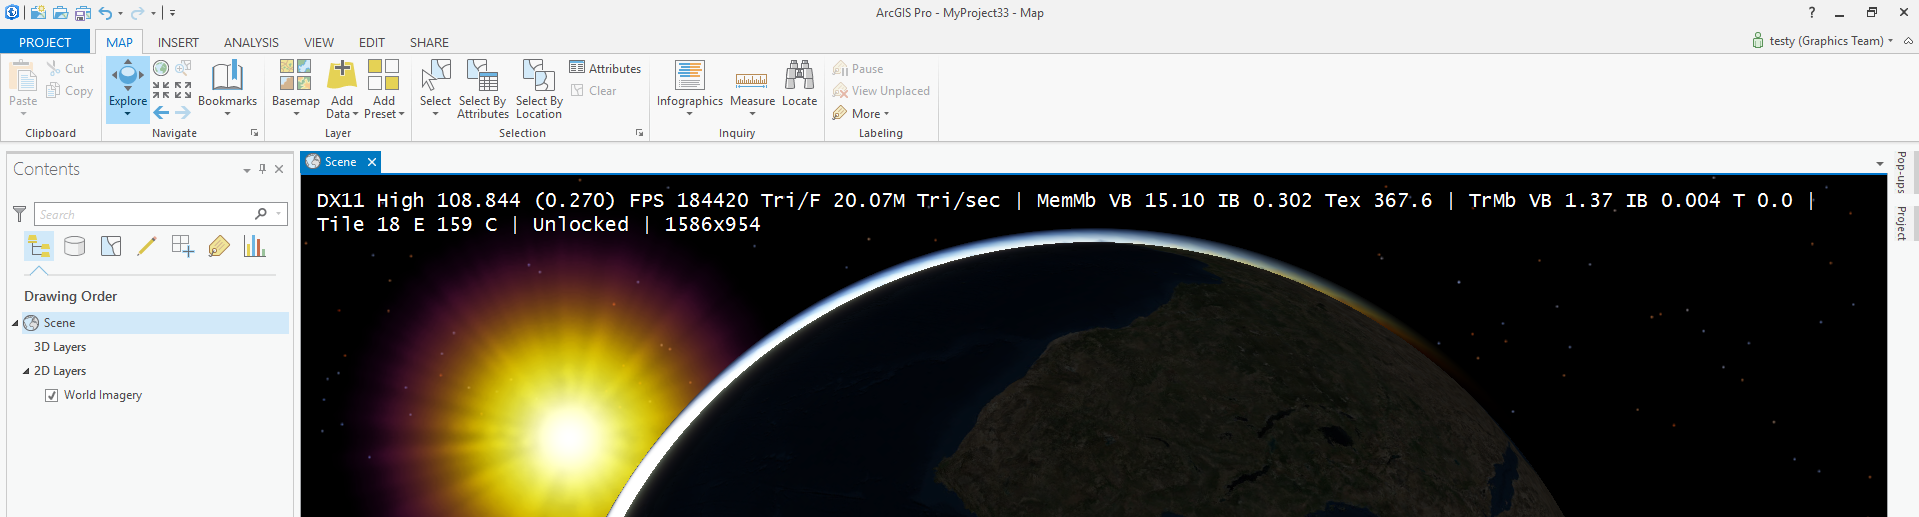
The graphics system inside of ArcGIS Pro is constantly monitoring the framerate and other stats about the views you’re displaying. You can get a readout of this information by pressing “Shift-E” with the map view focused. This will display a line of statistics at the top of the view (see screenshot below for an example).
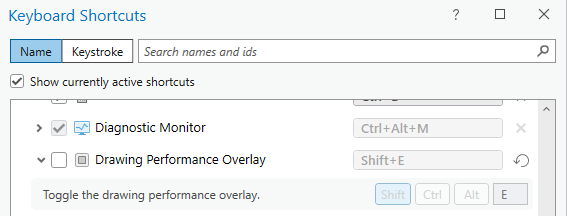
Note: In ArcGIS Pro 3.2 and later, the Shift-E shortcut is disabled by default.
To enable it, go to the shortcuts menu by pressing F12. Expand the Global group and check the box next to “drawing performance overlay”:
The diagnostic readout shows information about the status of rendering as an overlay on top of the view.
This readout is useful for detecting and troubleshooting LOW/INCONSISTENT FRAMERATE issues.
Each segment of this readout gives you information about the rendering system. Below are descriptions of each segment (color coded for easier understanding) and possible troubleshooting actions you can take based on this readout.
EXAMPLE READOUT:
DirectX11 High 40.461 (3.103) FPS 266813 Tri/F 10.77M Tri/Sec | MemMb VB 69.00 IB 0291 Tex 565.4 | TrMb VB 9.62 IB 0.004 T1.2 | Tile 99 E 511 C | Unlocked | 1854X954
DirectX11 = you’re running in DirectX11 (DirectX 11) mode – in older versions this may say “DX11”. This section will say “OGL4” when you’re in OpenGL mode.
ACTION: If you’re having trouble with performance, you can try switching to OpenGL, also upgrade graphics card driver from MANUFACTURER site (not from windows update). Some GPUs may have better performance in OpenGL. In ArcGIS Pro 3.2 and later you can also switch from DirectX11 to DirectX12 if your hardware supports this.
NOTE: If this readout says “WARP” then ArcGIS Pro was unable to detect a GPU that supports the required capabilities, and is using your CPU to emulate a GPU. This will in general result in poor performance. Try updating your GPU driver from the manufacturer’s website (NOT from windows update) or switching from DirectX to OpenGL in PROJECT->Options->Display.
High = you’re running in HIGH rendering detail
ACTION: If your framerate is low in 3D, try LOWERING rendering detail to one of the lower settings in Display Options.
40.461 (3.103) FPS = this is the average (and minimum) FPS for a short period of time.
ACTION: If Average is high but minimum is low, the user is experiencing “stuttering”. Usually this is a result of trying to load or render data that exceeds the GPU/Memory/CPU resources available. Try lowering the “out beyond” parameter of distance visibility to something closer, so you’re not trying to load so much. If overall FPS is low, it could indicate too much geometry in the scene for your graphics card (see the next item). Again, you can try lowering rendering detail or tightening distance visibility parameters. You can also try to generalize your geometries – see the “External Tools and related links” section below.
266813 Tri/F= the number of triangles being displayed per frame.
ACTION: If this goes too high, it will result in poor performance (FPS will be lowered beyond an acceptable amount). Try lowering distance visibility for layers with lots of geometry, or lowering rendering detail setting.
10.77M Tri/Sec = the number of triangles being processed per second.
ACTION: This is a multiple of the framerate times the triangles per frame. If this goes too high, it will result in poor performance (FPS will be lowered beyond an acceptable amount). Try lowering distance visibility for layers with lots of geometry, or lowering rendering detail setting.
| MemMb VB 69.00 IB 0291 = these tell you how many Vertex Buffers and Index Buffers are being used.
Tex 565.4 = you are using this amount (in Mb) of texture memory on the graphics card.
ACTION: if the sum of the above two numbers exceeds memory that is installed on the GPU (remember 1024Mb = 1GB) you will begin to seeing stuttering due to swapping of resources to disc/main memory/somewhere. Lowering Rendering Detail will help with this as it results in down-sampling of textures. Changing the visibility range for “out beyond” will help too, as you’ll have less texture and geometry in the scene.
TrMb VB 9.62 IB 0.004 T1.2 = This is the amount of information being transferred into/out of Vertex Buffers, Index Buffers, and Texture memory.
Tile 99 E 511 C = you’re using 99 Elevation tiles and 511 “color” tiles. This is the number of tiles being used to draw the surfaces (elevation + color source like a basemap) in your current view.
ACTION: None needed. This is informational only.
Unlocked | 1854X954 = you’re displaying a map view at 1854X954 pixels.
ACTION: None Needed. This is informational only.
These numbers are calculated for all views separately, so the numbers will be different per-view. In a Layout view, you’ll see this readout for the layout itself as well as any map views inside that Layout.
Diagnostic Tool: ArcMon (Diagnostic Monitor)
ArcMon or Diagnostic Monitor is a diagnostic dialog contained in ArcGIS Pro. To access the ArcMon dialog, press CTRL-Alt-M. This will open the ArcMon readout as shown below:
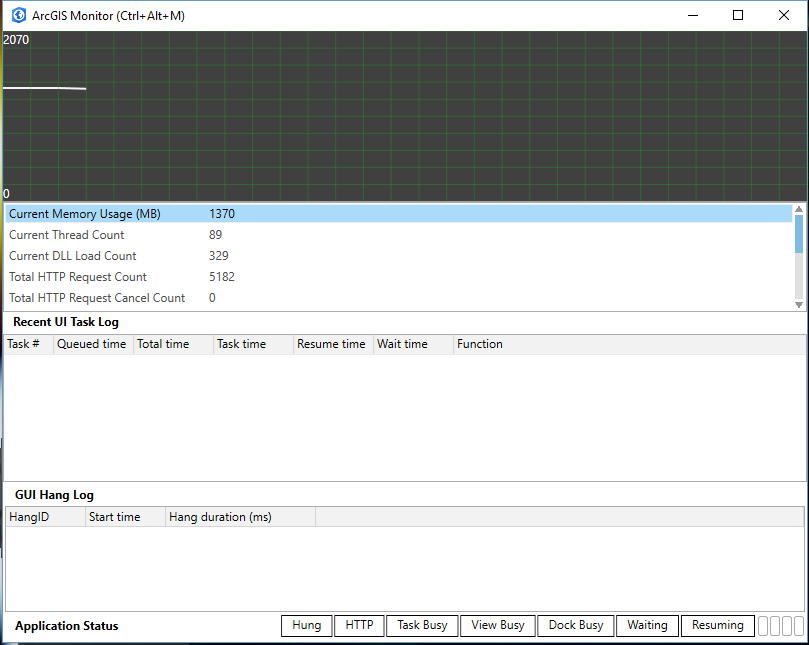
The ArcMon or Diagnostic Monitor dialog gives diagnostic information about different parts of the ArcGIS Pro application.
Note: the below section is for ArcMon in older versions. For more updated help on Diagnostic Monitor in 3.0 or later see https://pro.arcgis.com/en/pro-app/latest/get-started/arcgis-diagnostic-monitor.htm
The Diagnostic Monitor tool has four main areas of diagnostic readout.
Top Section: Performance Trend Graph
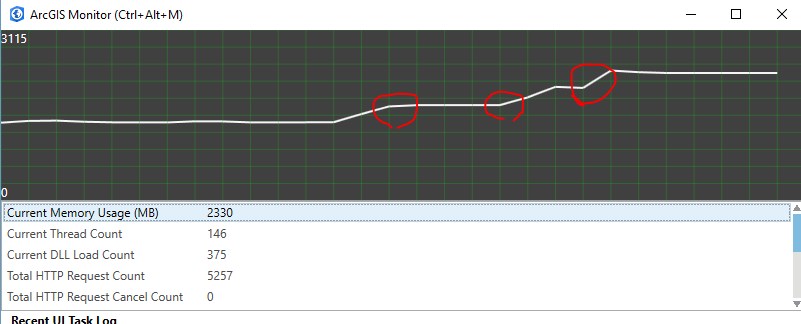 When one of the line items below the graph are selected, this graph will show that line item graphed over a sampling period of time. By default it shows a graph of memory usage. One way to use this is to see trends in (for example) memory usage when a particular tool or workflow is executed in ArcGIS Pro. As an example, in the graph above, you can see increases in memory usage (circled) when three separate global scenes are opened.
Middle Section: UI Task Log and GUI Hang Log:
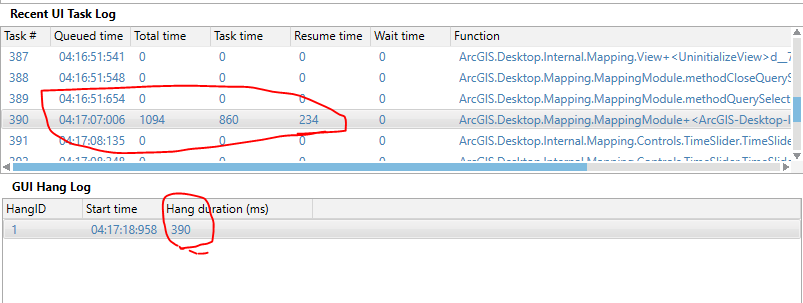 This section logs a list of UI Tasks that resulted from your inputs, and times their execution, resume and wait times. Any cases where the UI was disabled for an extended period of time is logged in the GUI Hang Log section below. This can be useful for determining which executed task has resulted in an unexpected UI Hang as in the APPLICATION UI IS GREYED OUT issue listed above – this can then be reported to Esri support.
In the example above, a brief hang is logged for adding Map Notes to the existing map. Note: All times are listed in milliseconds. There’s a whole library of research on the topic of response times and responsiveness testing, but as a general rule of thumb, delays of less than 400-500msec can be safely ignored, unless they are consecutive or regularly repeating.
Bottom section: Activity Indicators for parts of the Application
![]() The bottom of the ArcMon dialog contains red indicator “lights” to signify when a particular portion of the application is doing work. This is useful for getting some insight as to what portions of the application are exercised by your workflows, and also for troubleshooting “APPLICATION UI IS GREYED OUT” and “OPERATIONS ON LAYERS IN YOUR WEB GIS ARE SLOW” issues.
The bottom of the ArcMon dialog contains red indicator “lights” to signify when a particular portion of the application is doing work. This is useful for getting some insight as to what portions of the application are exercised by your workflows, and also for troubleshooting “APPLICATION UI IS GREYED OUT” and “OPERATIONS ON LAYERS IN YOUR WEB GIS ARE SLOW” issues.
These indicators, from left to right, indicate the following functions:
- “Hung” – when this indicator is red, it means that the application has stopped responding to messages from the operating system. This is more serious than cases where the application is responding (view is able to navigate, etc.) but buttons are greyed out. If this lights up for an appreciable amount of time (for instance, more than a half second), then something inside the application has gone wrong. Please report the actions that led to this indicator to technical support. You can also float your mouse over the indicator and get a tooltip that gives the cumulative “Hung” time in milliseconds for your entire session.
- “HTTP” – When this indicator is red, it means the application is requesting content using HTTP requests – for instance, when requesting tiles from a basemap in ArcGIS Online. If you are experiencing OPERATIONS ON LAYERS IN YOUR WEB GIS ARE SLOW issues, this may indicate network congestion problems, or that your on-premises or hosted portal is overloaded with requests. Consider using an external tool such as Fiddler (see the “Related Links” section) for this.
- “Task Busy” – when this indicator is red, it means a UI task is executing. Some tasks may take longer than others, so this indicator being lit for an excessive amount of time can be OK. You can also float your mouse over the indicator and get a tooltip that gives the cumulative “Task Busy” time in milliseconds for your entire session.
- “View Busy” – This indicator is red when a pane is being constructed (for example, when a map view pane is opened). You can also float your mouse over the indicator and get a tooltip that gives the cumulative “View Busy” time in milliseconds for your entire session.
- “Dock Busy” – this indicator shows when a dockpane (for example, the symbology pane) is being constructed or destroyed.
- “Waiting” – This indicator is red when a UI Task is waiting for the Graphics system to release access to a map, layer or project’s properties. If this indicator remains red for an appreciable time, it can indicate contention between UI tasks and the Graphics system – which can contribute to “APPLICATION UI IS GREYED OUT” issues. You can also float your mouse over the indicator and get a tooltip that gives the cumulative “Waiting” time in milliseconds for your entire session.
“Resuming” – This indicator is red when the UI tier is waiting for the Graphics system to resume rendering after a change was made to the map, layer, or project’s properties.
Lastly, the rightmost 4 rectangles indicate when the application or the graphics subsystem are attempting to read properties of the map, layers, or project. While they are red, some part of the application is retrieving properties of the map, layers, or project in order to do some work. Note: Depending on how many CPU cores are available on your system, you may see some of these rectangles greyed out. This is because ArcGIS Pro will not spawn more property-reading threads than cores are available on the system.
External tools and related links
- For the issue OPERATIONS ON LAYERS IN YOUR WEB GIS ARE SLOW, it may be useful to diagnose connectivity and responsiveness of the server or portal involved by investigating requests and responses from the client. Fiddler is an HTTP proxy and diagnostic tool that can also provide some insight to HTTP requests that take a long time.
- When the number of triangles being displayed is very large (as in the LOW/INCONSISTENT FRAMERATES case), the primary recommendation is to lower the distance at which the layer becomes visible. However, for very dense geometry, sometimes it can help to reduce or simplify the geometries being rendered. The solution to this can take many forms depending on the source geometries being used:
- If your geometries are multipatches, or you’re using a multipatch as a marker symbol, using tools to simplify the geometries can help.
i. The “3D Workshop Feature Extraction Tools” includes beta tools to repair and even simplify Multipatch geometries: https://geonet.esri.com/people/GTaylor-esristaff/blog/2016/06/24/3d-workshop-feature-extraction-tools
ii. The “Local Government Scenes” solution also contains generalization tools for multipatch geometries (the “LOD2” and “LOD3” building tools in http://solutions.arcgis.com/local-government/help/local-government-scenes/ )
-
- If you’re using traditional GIS geometries such as points, lines and polygons, there are generalization tools available that will allow you to reduce the density of geometry that is present in your features.
i. https://pro.arcgis.com/en/pro-app/tool-reference/cartography/an-overview-of-the-generalization-toolset.htm gives an overview of this toolset. These tools are installed with ArcGIS Pro and require no additional licensing.
ii. The Esri Production Line Toolset extension (for ArcGIS Desktop – usable from ArcCatalog) also contains generalization tools: http://www.esri.com/software/arcgis/extensions/production-mapping/key-features

Commenting is not enabled for this article.