By now, you may have seen the new item pages and have had a chance to use them. If so, hopefully it has been a seamless transition and you’re finding that the new layout and additional features help you to get your work done quickly and easily. One aspect of this new design is the addition of the Data tab on feature layer items. The Data tab is where you explore and optionally edit the attribute data of a feature layer. As you may have noticed already, the Data tab does more than just display a table of attribute information. It provides a holistic view of a layer’s attribute data by integrating information such as related records and attachments, while also providing a detailed look at each field in the layer. If this sounds interesting to you, keep reading to get a quick overview of the new features and get a glimpse of the road ahead.
Understanding attributes helps you tell a good story
The key to making a map that tells a good story is to understand the attribute data within the layers on the map. This task can be especially challenging if you aren’t familiar with the layers you’re showing on your map. Knowing what attributes you have and what the values mean helps you make the right decisions for how to draw the layer and configure popups that others can view.
So, how does the Data tab help you understand the data? Simply, the Data tab helps you get the “big picture” of a layer. The Data tab allows you to view the layer attributes in a table that does all the things you expect from a table. For example, you can sort on a field, show or hide fields, and edit field values (more on this later). The layer in the figure below was created by aggregating trees in Portland, Oregon to census blocks. The attribute table shows you the count of trees in each census block and the most and least common tree species in that block.

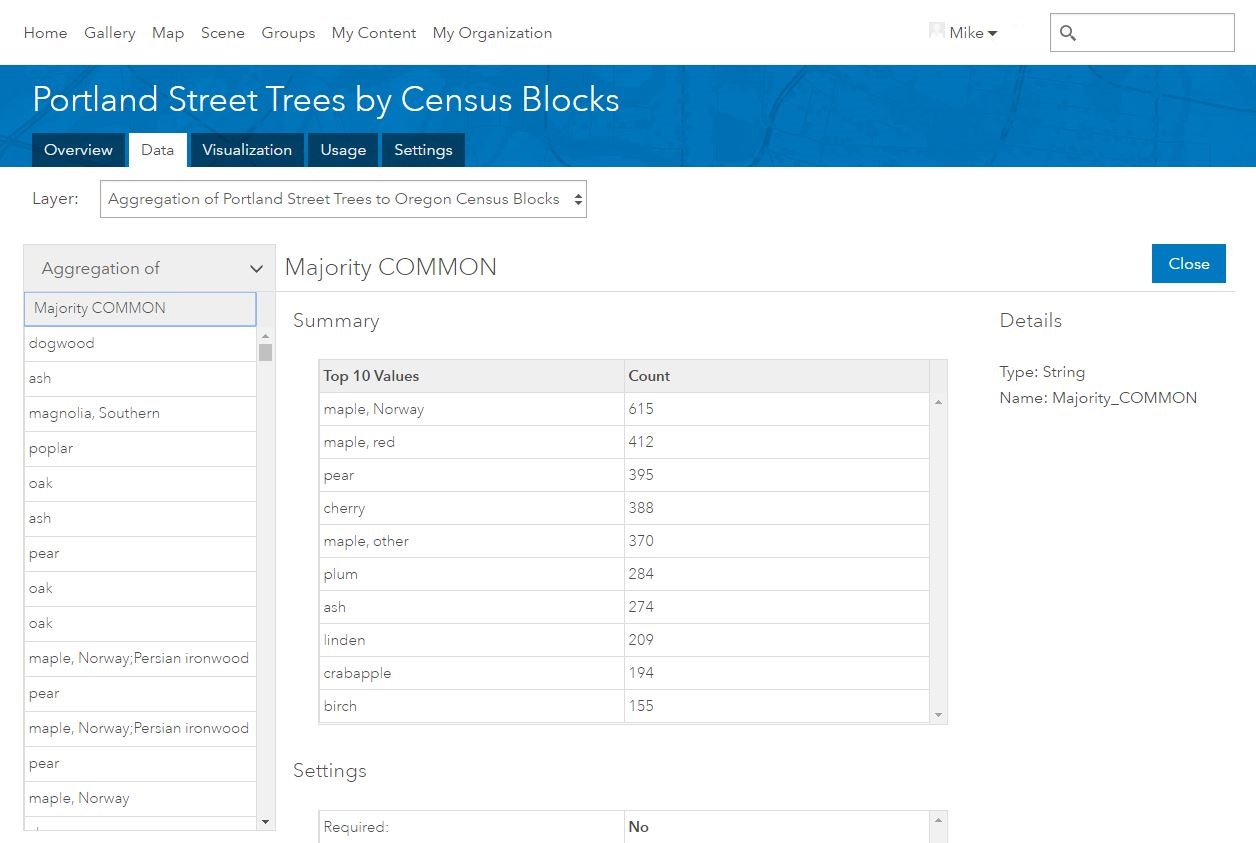
The Data tab also gives you detailed views of individual fields. This detailed view allows you to simultaneously look at the field’s values and properties, such as the field name, type, settings, and summary information, such as a histogram and statistics for numeric fields and a count of the top ten values for text fields. Click on the field name in the table to see its details. In the figure below, you can see that the Norway maple is the most common tree in 615 census blocks.
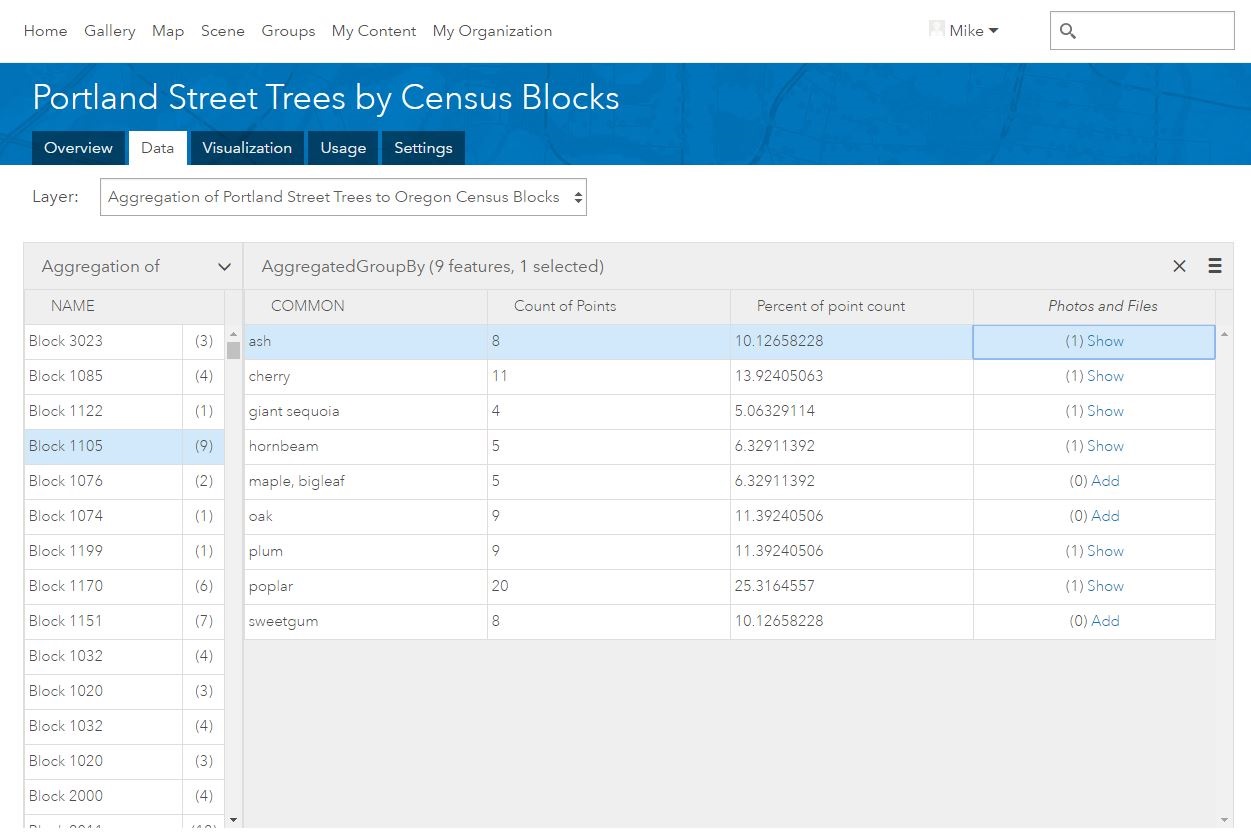
Sometimes layers have additional related information. For example, a parcel layer may reference a list of owners for each parcel with a set of pictures that document the buildings on the property. The pieces of related information are exposed as columns directly in the table. To help distinguish the related information from the fields in the table, the related information columns are appended to the end of the table, with the column name shown in italics. Each record in the table shows the number of related records associated with it. Click Show to see the related records displayed side-by-side with the layer’s table. In the Portland tree example, you can see that census block 1105 has nine different species of trees in it. Click on different rows to see the tree species in that census block.
Editing attributes keeps layers current
Because layers are rarely static, you’ll likely need to update them periodically. You (and any administrator) have full access to edit layer attributes at any time. You can also allow others to edit the attributes by enabling editing on the layer and sharing the layer with the appropriate people. (Note that members in your organization that don’t have the editing privilege given to them by an administrator won’t be able to edit the attributes.)
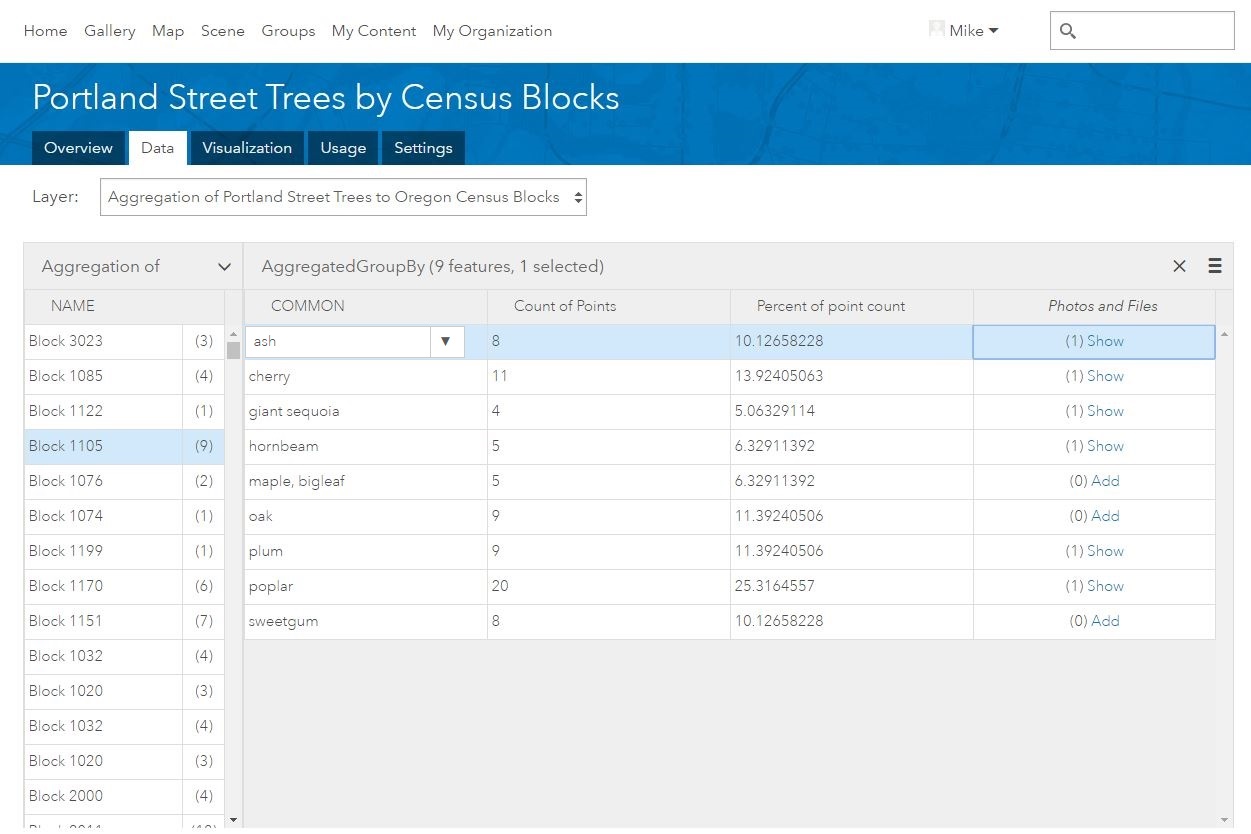
To edit an attribute value, simply double-click on a cell to change its value. You can also edit the attribute values in related tables the same way. The table helps you set the right value, for example, presenting a list of choices when appropriate or informing you if the value you entered is outside a predefined range of values. The figure below shows how you can change the common name of the tree with a drop-down list.
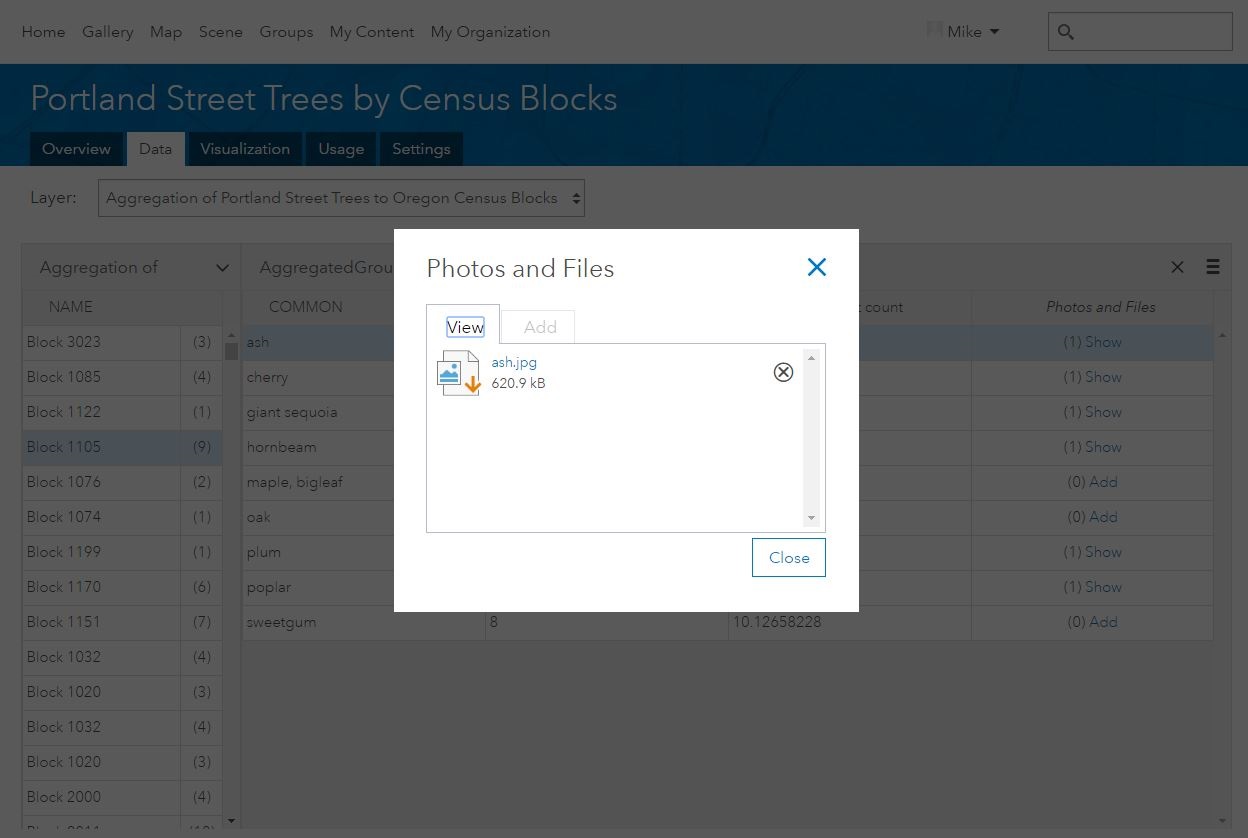
If you want to associate photos and files with your attribute data, you can easily enable attachments that allow you to store these files with particular features in the layer. Adding and viewing files is quick and easy. Here, an attached picture of an ash tree shows what one looks like.
Waypoints on the road ahead
As you can see, the Data tab makes it easier to work with attribute data. With the latest update, we’ve just begun to give you all the features you need. We still have work to do to expand the data management and layer configuration abilities exposed on the Data tab. Here’s a glimpse at some of the ideas we’re considering that may (no guarantees) be added to the Data tab in future updates of ArcGIS Online. This is not a definitive list and we welcome your feedback and suggestions.
Fields
- Add a field description to help communicate what information is stored in the field and what the values actually mean.
- Configure field properties, such as the default value, whether it can accept null values, and valid range of values for numeric fields.
- Calculate field values.
- Add and remove fields.
- Set the display formatting for fields.
- Set field expressions, for example, where the value of the field is automatically set based on the values in other fields.
Table
- Search by attributes to find matching records and perform some action on them, for example, edit their attribute values.
- Define a filter, or definition query, to limit the features shown.
- Add related records to features.
- Define new related tables.


Article Discussion: