Since incorporating the Live Stream Gauge Map into the Community Maps program, a number of state and county governments have contributed their gauge networks to the map, and now, we’ve added the first set of international contributors.
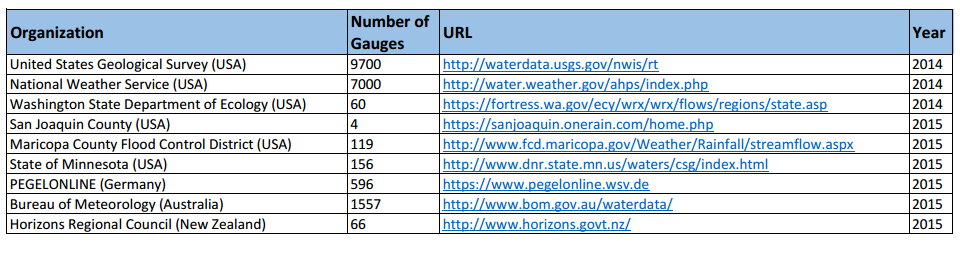
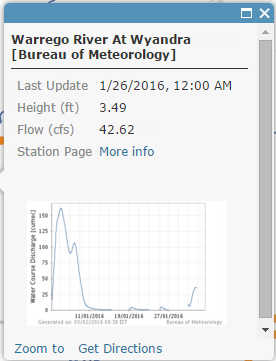
Real-time stream gauge observations from Australia’s Bureau of Meteorology, New Zealand’s Horizons Regional Council, and Germany’s Waterways and Shipping Board are viewable in the map, which is updated every hour from live telemetry using ArcGIS for Server’s GeoEvent Extension. By opening the map and clicking on one of the gauge points, you can see the current depth and flow rate in rivers all across the world. We will soon release a metric version of the map as well.
In addition to uses in flood response and navigation, this map will also be valuable for river authorities handling allocation requests, environmental groups monitoring ecosystem health, or even kayakers or fisherman planning a weekend trip. Feature access is enabled, so this service can be used in analysis and geoprocessing routines. Have you used the Live Stream Gauge service? If so, tell us your story in the comments! We are also looking for more contributors, especially local governments and river authorities. If you know of an organization that maintains a stream gauge network with live telemetry, send a note to streamgauges@esri.com and we’ll work with them to add their gauges to the map!


Article Discussion: