This is the final post in a three-part series exploring 3D data-driven visualizations in web applications using the ArcGIS API for JavaScript version 4.0.
1. Working with icons, lines, and fill symbols
2. Working with objects, paths, and extrusion
3. Using attributes to represent real-world sizes of features
In the previous posts I demonstrated using flat icons, lines and polygons versus volumetric objects, paths, and extrusions for thematic visualizations using attributes such as population, party affiliation, and graduation rates in a SceneView.
In this post we’ll discuss how to take advantage of visual variables in 3D to represent features as they appear in the real world. For example, if you have a dataset of pipes, you may have an attribute field that stores the diameter of each feature. Perhaps you have a point dataset of trees with trunk width, height, and canopy sizes as attributes. You can use visual variables to create symbols that represent their actual sizes in the view.
Before taking this approach, keep the following in mind:
1. By default, units in size visual variables are expressed in meters when working with volumetric symbol layers.
2. Attribute fields used for mapping real-world sizes must be number fields, not strings.
Next we’ll work through a few examples involving features of various geometry types.
Polygons: extruding building footprints
Suppose you have a polygon dataset of building footprints with an attribute storing each building’s height. You can create a simple 3D representation of the actual height of each building using an ExtrudeSymbol3DLayer within a PolygonSymbol3D.
When visualizing real-world sizes, there is no need to set stops for mapping min/max values to min/max sizes. Since the data values represent true sizes, we’ll directly use them to create the sizes of each of our features. Since the sizes of volumetric symbol layers are defined in meters by default, you must set the valueUnit property of the size visual variable to the units of the data if meters were not used in the original measurement.
In the sample below, we have a dataset of building footprints that contains an ELEVATION field storing the heights of each building in feet. To set the appropriate sizes of the buildings, we only need to set the field property to the ELEVATION attribute and indicate the unit of measure in the valueUnit field (in this case “feet”).
var renderer = new SimpleRenderer({
  symbol: new PolygonSymbol3D({
    symbolLayers: [new ExtrudeSymbol3DLayer()]
  }),
  visualVariables: [{
    type: "size",
    field: "ELEVATION",  // The field storing height values for each building
    valueUnit: "feet"  // converts and extrudes all data values in feet
  }]
});
CLICK HERE TO VIEW THE LIVE SAMPLE
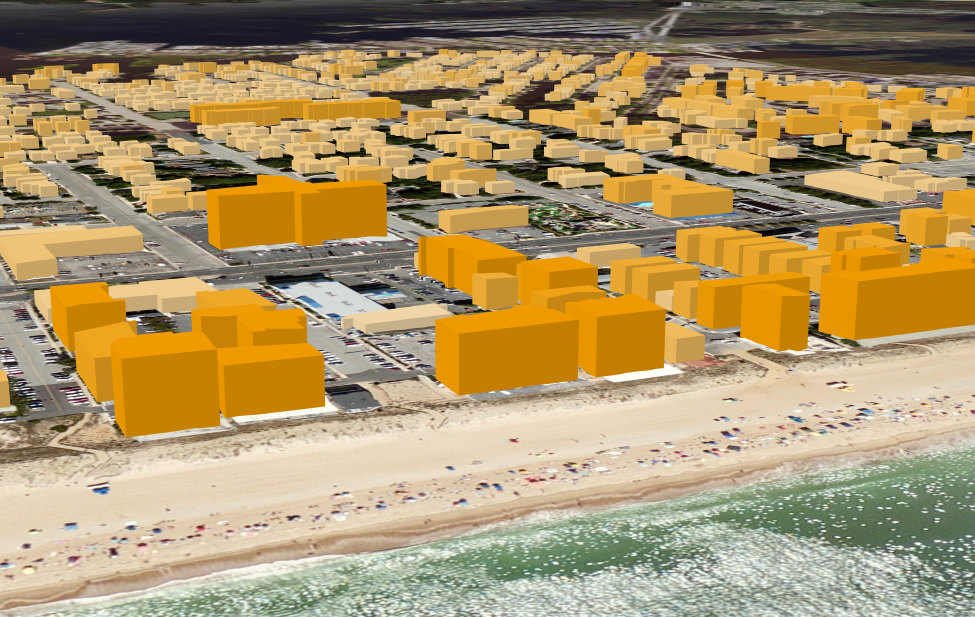
Be aware that the extrusion is calculated from the surface of the terrain. Therefore, the roof of each extrusion won’t necessarily be horizontal. They may slant or curve depending on the underlying topography. To avoid this, the data must have correct z-values and the layer’s elevationInfo.mode must be set to “absolute-height”.
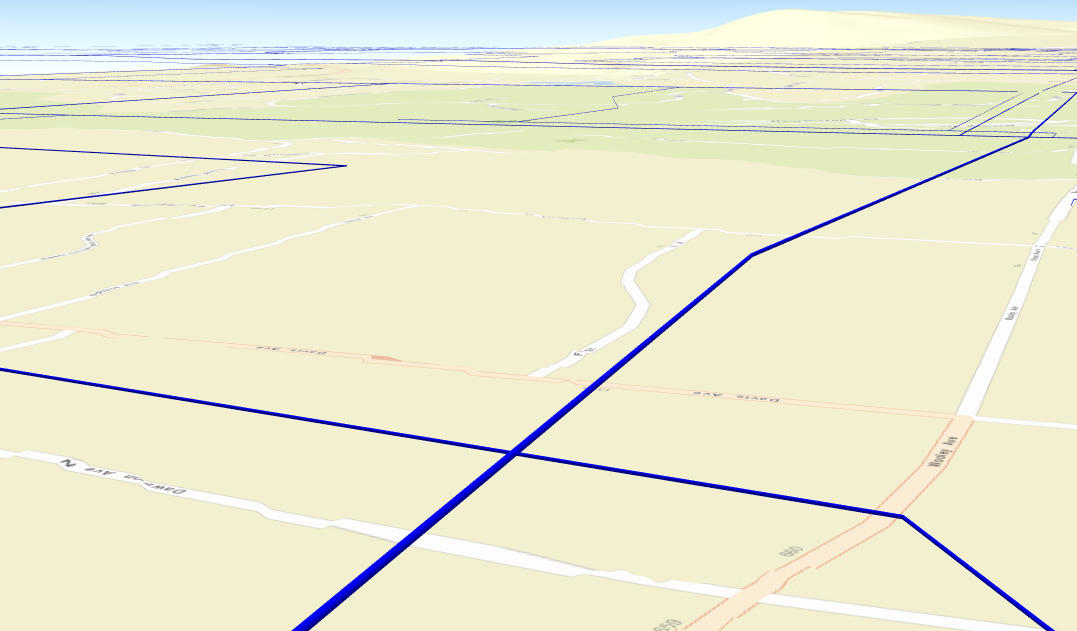
Lines: Pipe diameter
The following sample demonstrates how to use PathSymbol3DLayer to visualize 2D line data as 3D tubes. The Pipe_Diameter field in a service representing water pipelines contains the diameter of each pipe in inches. So we’ll set the valueUnit property to “inches”.
var renderer = new SimpleRenderer({
  symbol: new LineSymbol3D({
    symbolLayers: [new PathSymbol3DLayer({
      material: { color: "blue" }
    })]
  }),
  visualVariables: [{
    type: "size",
    field: "Pipe_Diameter",
    valueUnit: "inches"  //converts and extrudes all data values in inches
  }]
});
These features don’t appear at their true location underground since they don’t contain z-values. To make the features easier to view, I gave the layer an offset of 20 meters above the ground using the elevationInfo property of the layer.
CLICK HERE TO VIEW THE LIVE SAMPLE
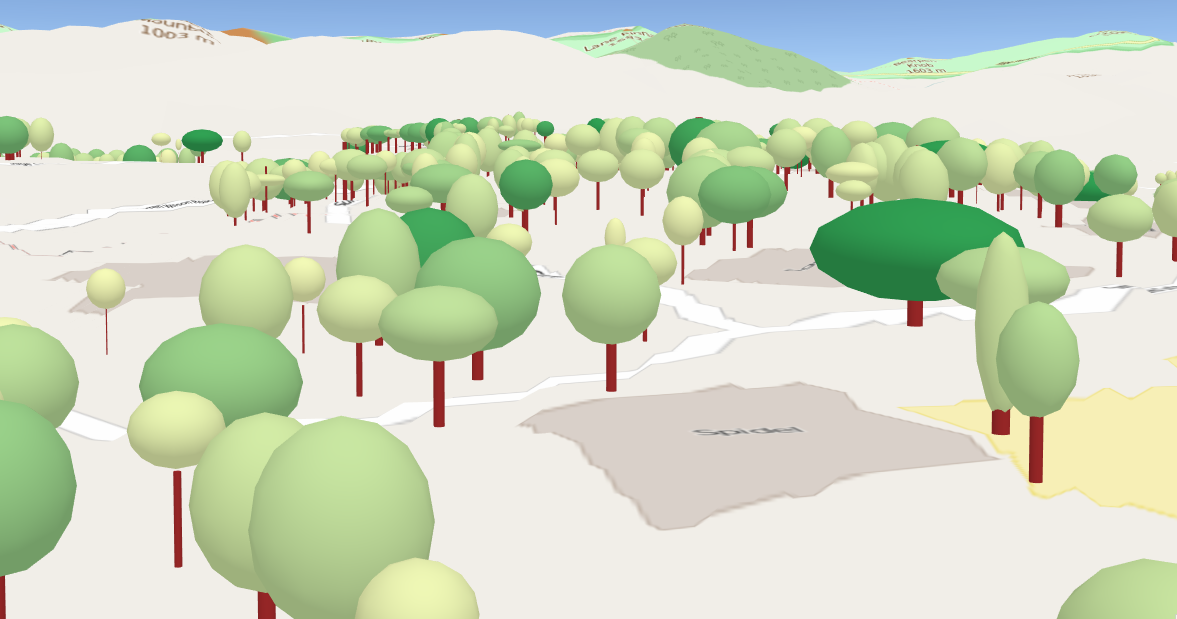
Points: Trees
Point data can be more complicated to visualize with real world sizes because they are represented as volumetric objects with various dimensions. An example is visualizing trees from point data. It would appear difficult to do considering each tree has a unique shape based on trunk height, width, and canopy size. However, thanks to the axis property on the size visual variable, we can go a long way in representing real world tree size with just a few lines of code.
In the following sample, we use a dataset of trees from Warren Wilson College. The dataset is complete with attributes for tree height, trunk diameter, and canopy diameter. As of the current release of the ArcGIS API for JavaScript (4.0), visual variables are only supported when using one symbol layer per symbol. Support for assigning visual variables to specific symbol layers may be added in a future release of the API. For now, we’ll symbolize trees with two feature layers – one for trunks and one for the canopies.
To depict trunks, we’ll use a cylinder primitive in an ObjectSymbol3DLayer. Notice the trunk height is measured in feet, and the trunk diameter is measured in inches.
var trunkRenderer = new SimpleRenderer({
  symbol: new PointSymbol3D({
    symbolLayers: [new ObjectSymbol3DLayer({
       material: { color: "brown" },  //color the trunk brown
       resource: { primitive: "cylinder" }  //give each the shape of a cylinder
    })]
  }),
  visualVariables: [
   {
     type: "size",
     axis: "height",  // Set the size on the height axis
     field: "Height",  // Tree height in feet
     valueUnit: "feet"  // converts and visualizes all sizes in feet
   }, {
     type: "size",
     axis: "width-and-depth",  // set the size on both width and depth axes
     field: "DBH1",  // Trunk diameter in inches
     valueUnit: "inches"  // converts and visualizes all sizes in inches
   }
  ]
});
Then we’ll assign the following renderer to a separate layer pointing to the same point data to visualize the tree canopies. Notice that for canopies we make use of all three axes of the size visual variable with separate attributes on the ObjectSymbol3DLayer. I’m also including a color visual variable to visualize the carbon storage of each tree.
var crownRenderer = new SimpleRenderer({
   symbol: new PointSymbol3D({
     symbolLayers: [new ObjectSymbol3DLayer({
       material: { color: "green" },
       resource: { primitive: "sphere" }
     })]
   }),
   visualVariables: [
     {
      type: "size",
      axis: "height", // set the crown height on the height axis
      field: "Crown_Height", // Crown heights are expressed in feet
      valueUnit: "feet" // converts and extrudes all data values in feet
    }, {
      type: "size",
      axis: "width", // set the crown diameter (east to west) to the width axis
      field: "Width_EW", // crown diameter (EW) is expressed in feet
      valueUnit: "feet" // converts and extrudes all data values in feet
    }, {
      type: "size",
      axis: "depth", // set the crown diameter (north to south) to the depth axis
      field: "Width_NS", // crown diameter (NS) is expressed in feet
      valueUnit: "feet" // converts and extrudes all data values in feet
    }, {
      type: "color",
      field: "C_Storage",  // Carbon storage
      stops: [
        { value: 0, color: "#f7fcb9" },
        { value: 800, color: "#31a354" }
      ]
    }
   ]
});
Since the elevationInfo offset only takes numbers and not expressions, we cannot place the crown of each tree exactly where it was measured. For the purposes of this sample, I set a filter on tree height and assigned an offset of 6.5 meters to all tree crowns. This works well for most of the features even though it isn’t accurate for all trees in the map.
elevationInfo: {
  mode: "relative-to-ground",
  offset: 6.5
}
CLICK HERE TO VIEW THE LIVE SAMPLE
This sample demonstrates that you can use visual variables to render real-world sizes of objects combined with a color ramp to create a hybrid thematic visualization that provides context to how features look in the real world. Again, a future release of the API may allow for creating this application without requiring the use of two separate feature layers.
Subsurface rendering: Wells and earthquakes
The viewingMode of a SceneView allows for creating local scenes instead of the default global scene. Local scenes allow for localized subsurface mapping. The following sample comes directly from the Samples page of the ArcGIS API for JavaScript API reference.
In this sample we have two layers of point data: oil/gas wells and earthquakes. The goal is to map the location of the epicenter of each earthquake, symbolize its size thematically based on magnitude, and depict the actual depth of nearby oil and gas wells. Because this sample is a little more complex, I’ll only focus on the rendering of the subsurface features.
Since the earthquake service has z-values, features are automatically placed in their proper location as long as returnZ is set to true on the layer. Now we can use visual variables to alter the size of each sphere based on the magnitude of the quake:
var quakesRenderer = new SimpleRenderer({
  symbol: new PointSymbol3D({
    symbolLayers:[new ObjectSymbol3DLayer({
      resource:{ primitive: "sphere" }
    })]
  }),
  visualVariables: [{
     type: "size",
     field: "mag",
     axis: "all",
     stops: [
       { value: 2, size: 100 },
       { value: 5, size: 2000 }
     ]
  }]
});
Wells are treated a little differently since they can be represented as shafts or vertical lines. Instead of spheres, we’ll use cylinders to represent them. We’ll add a size visual variable on the height axis and set the min and max sizes to negative values so the cylinders will render underground to the actual depths of each well.
We’ll also set a size visual variable on the width axis to a constant value of 50 meters. I exaggerated this value from the actual width of each well so they will be easily visible in the view.
var wellsDepthRenderer = new SimpleRenderer({
  symbol: new PointSymbol3D({
    symbolLayers: [new ObjectSymbol3DLayer({
      resource: { primitive: "cylinder" },
      width: 50
    })]
  }),
  visualVariables: [{
    type: "size",
    field: "DEPTH",  // depth measured in feet
    axis: "height",
    stops: [ // negative values ensure the features are rendered underground
      { value: 1, size: -0.3048 },
      { value: 10000, size: -3048 }
    ]
  }, {
    type: "size",
    axis: "width",
    useSymbolValue: true  // sets the width to 50m
  }]
});
When viewing the live sample, you will need to be familiar with SceneView mouse navigation to view the features under the surface.
CLICK HERE TO VIEW THE LIVE SAMPLE
Whether it’s mapping features with their real-world locations and sizes or creating thematic representations of statistical data, using visual variables with 3D symbols in the 4.0 ArcGIS API for JavaScript allows you to easily make impressive 3D visualizations.
Note that using visual variables requires that you know your data, especially when creating thematic visualizations. Smart Mapping will be included in a future 4.x release of the the ArcGIS API for JavaScript, which will allow you to create exploratory 3D visualizations.
To view all posts related to this series, click here.

Article Discussion: