Are you an ArcGIS user familiar with selection methods such as Select by Location and Select by Attribute and tools such as Get Count and Clip? Similar functionality exists in GeoPlanner’s built-in analysis tools and dashboards. In this three-part miniseries, you will learn how to perform selections using Find Existing Locations, count your features using a gauge, and mimic the Clip tool using Overlay Layers.
Feature Count in a Gauge
The question from GeoPlanner Tools and Methods – Part I remains: how many trees are in the park? As part of the beautification project, you are tasked with making sure that a park the size of the one in your study area has approximately 60 trees.
GeoPlanner offers a simple solution for counting the number of features in a layer. In ArcGIS for Desktop, a common strategy for answering this question is to use the Get Count tool, which returns the total number of rows for the layer of interest. This will give you the number of trees in the park. In GeoPlanner, this is done by using a feature count in a gauge.
Note: You can accomplish this same task with a chart. Charts are useful for displaying the types of features within a plan. Gauges allow you to quickly understand the total count of features in your plan.
Step 1: Create a new GeoPlanner scenario, importing the trees in the park layer (Step 4 output from GeoPlanner Tools and Methods – Part I) as your point of interest layer.
Step 2: In the Evaluate segment, click the Dashboard widget.
Step 3: Click the Add a Performance Indicator widget and give your Performance Indicator a caption. Include a Range and Target. As previously mentioned, the goal of your beautification project is to have about 60 trees in a park of this size. Therefore, 60 is set as your target.
Step 4: Set Scenario Layer to “Point of Interest” and enter “1” into the Equation (per feature) field. This will count each feature one time in order to sum all features in the map extent. Select Sum from the adjacent dropdown box.
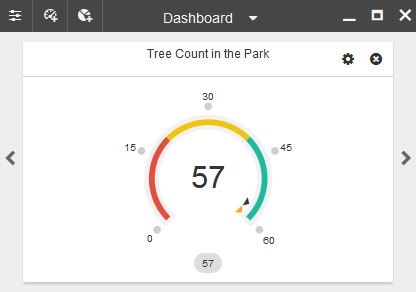
By performing a feature count in a gauge, you see that there are currently 57 trees in the park. You can compare your findings with the target you have set, 60, by examining the position of the black arrow (current count) in relation to the yellow arrow (target count).
Coming soon, the final segment of the Tools and Methods miniseries will explain how Clip functionality is incorporated into GeoPlanner and how the application’s analysis tools can help drive the decision-making process.
Contributed by John Preysner, intern with the GeoPlanner team, 2015.

Article Discussion: