As GIS professionals we all know that adding a spatial element to data makes it much more valuable. One of the key benefits of GIS has always been, and always will be, the integrative power to bring location information together in a map – and then analyze it for insights and patterns that help explain and improve efficiencies. Today bringing information from other systems into GIS is easy with the ArcGIS platform. In fact, Esri devotes a whole section to integration for water utilities. A few commonly integrated water industry data types include:
- Customer Service Calls
- Billing and Consumption Information
- Work Orders
- SCADA
- AVL
There are many ways to integrate with ArcGIS, however this blog is going to focus on two simple and reliable methods for brining information into the ArcGIS platform. You can use Python script or GeoEvent Extension for ArcGIS Server.
Python – Don’t Be Scared of Scripting
Python is a simple, powerful script to automate the process of spatializing your data. For example, your organization may want to refresh feature services on a scheduled basis with completely with new data, update only certain features with new information, and/or push existing values into an archive table.
ARCREST is a set of Python tools to help you work with ArcGIS REST API for ArcGIS Server, ArcGIS Online, and ArcGIS WebMap JSON. You can use ARCREST to work with feature service REST endpoints, so you can
- Add feature services
- Delete feature services
- Update feature services
- Query feature services
- Upload attachments to feature services
- Publish a .MXD as a feature service to ArcGIS Online
- Get ArcGIS Online or ArcGIS Server item information
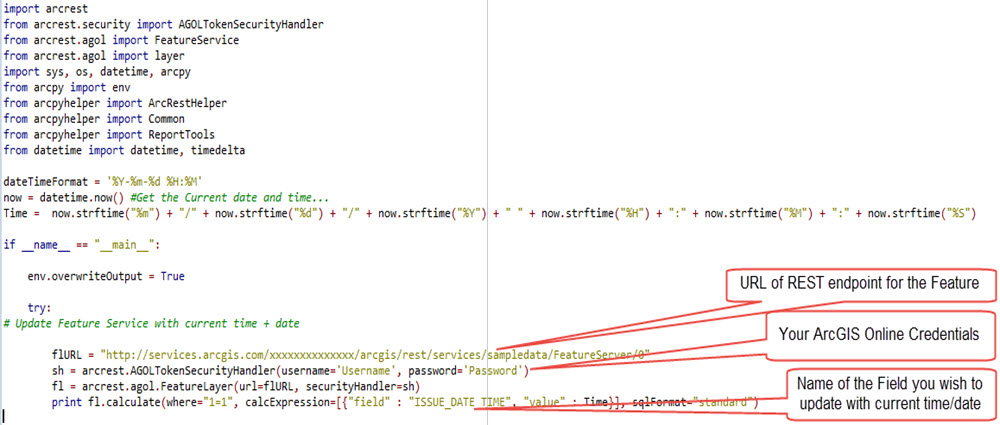
This example shows how easy it is to update all features in a feature service with the current time and date with ARCREST.
This help link shows you how to run a Python script automatically as a scheduled task in Windows. You could set your task to run every night at midnight, for instance, to ensure ArcGIS.com has your most up-to-date features the next day, every day.
In fact, you can easily take this a step further. At the same time your script refreshes the data, it can perform analysis too. Esri’s High/Low Water Consumption solution uses this. The solution uses a Python script to update your services, maps, and dashboards at scheduled times. In addition, daily, weekly, or monthly records of high and low consumption can be stored as an informative web map using ArcGIS Online. This lets you query and view customers with high and low water usage.
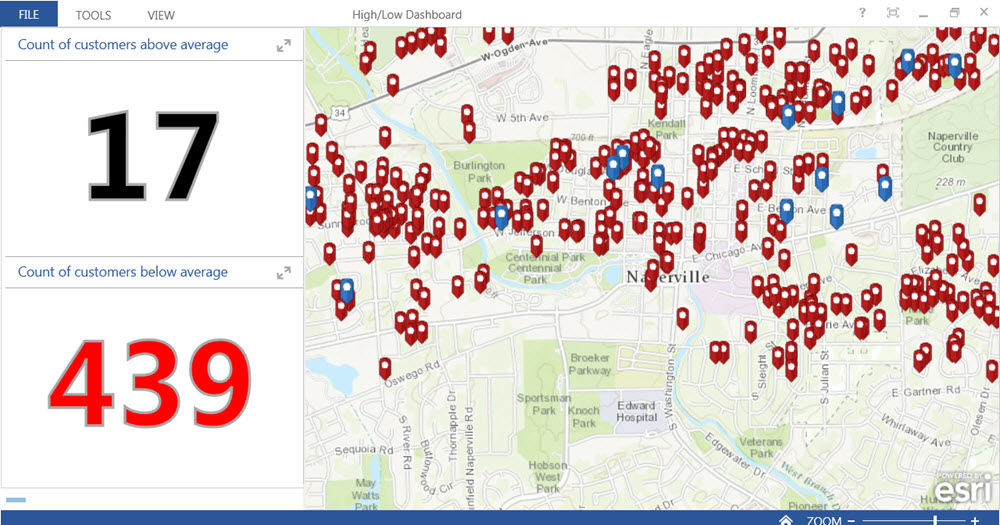
Dashboards display the latest information, brought in by Python script, from your utility databases. This one refreshes daily to show the utility its highest- and lowest-use customers.
Real Time with GeoEvent
Python is great for daily updates, but if your utility would like seeing data changes in real time, it can with the GeoEvent Extension for ArcGIS Server. GeoEvent brings information from other systems into the GIS in real time. In addition, it can issue notifications to users in real time, based on criteria you configure. For instance, you can be automatically alerted to a main break.
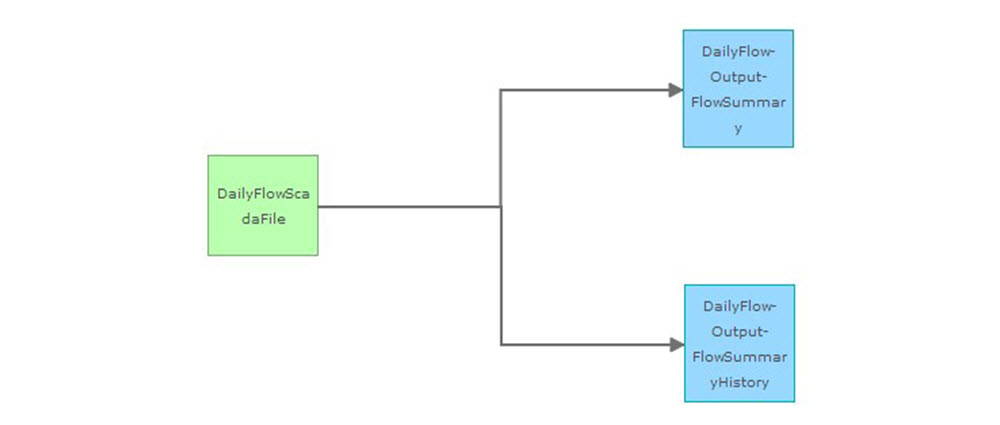
An example of a great solution that uses GeoEvent is the Water SCADA Processor solution. Water SCADA Processor contains all the sample data and instructions you need to
- Map services for pumps, tanks, flow meters, daily tank changes, and daily flow summaries
- Automatically add historic data in archive tables
- Perform real-time calculations and filtering before issuing smart notifications.
All solutions contain sample data and detailed instructions on how to build the solution.
Get Started
With Python and GeoEvent, it’s easier than ever to spatialize virtually any location data. Automate specialization with Pytho, GeoEvent, or a hybrid. Gain greater clarity into your data in real-time. Plus, routinely ensure a steady supply of data into your GIS.
Take a free web course in Python for ArcGIS Desktop 10.
Learn more about GeoEvent Extension for ArcGIS Server
Article Discussion: