The ArcGIS Online platform includes a rich set of imagery content that is available to you with your ArcGIS Online subscription. The imagery is available for different coverage areas, at different levels of detail (from 250m to 1m per pixel resolution), and different update frequencies (from annually to daily). In addition to the popular World Imagery basemap, this includes Landsat 8 imagery, MODIS imagery, and NAIP imagery, as summarized in this earlier post.
The image layers can be very useful resources to reference in your maps and apps. WIRED recently published a fascinating post on NASA’s Best Images of Earth From Space in 2014, featuring over two dozen beautiful and informative images captured last year and published in NASA’s Earth Observatory. Several of these images were from NASA satellites and sensors whose imagery is accessible through ArcGIS Online, including MODIS Aqua and Terra and Landsat 8. The post inspired me to recreate some of these images as interactive ArcGIS Online maps and apps, such as:
- New Island in the Ring of Fire (Story Map featuring Landsat 8 imagery)
- Funny River Fire, Alaska (Story Map featuring Landsat 8 imagery)
- A Great Freeze Over the Great Lakes (Web Map featuring MODIS Aqua imagery)
- Sea Ice, Greenland Sea (Web Map featuring MODIS Aqua imagery)
- Haze in the Kashmir Valley (Web Map featuring MODIS Terra imagery)
Publishing Web Maps with Online Imagery
The maps and apps above were all published by creating a simple web map that referenced one or more image layers, in addition to a basemap for reference purposes. In creating the web maps, there were a couple different patterns that were used:
Reference Specific Image by Name or Date
The image services publishing the MODIS Imagery and the Landsat 8 Imagery both include thousands of unique scenes, going back over one year, which each have unique names and dates. If you want to reference one or more of these scenes in a web map, you can do so by creating a new layer and setting a filter on the name or date of the scene. Below are the steps that were used to do this for the Sea Ice, Greenland Sea web map, featuring this MODIS image from the Aqua satellite captured on August 18, 2014.
- Sign in to ArcGIS Online with your account and go the Gallery of Esri Featured Content.
- Click on category of Imagery and sub-category of Temporal Imagery to filter gallery, then open the MODIS (True Color) map and pan to the eastern coast of Greenland.
- In the Content for the map, turn off the MODIS Terra layer. For the MODIS Aqua layer, select Enable Time Animation.
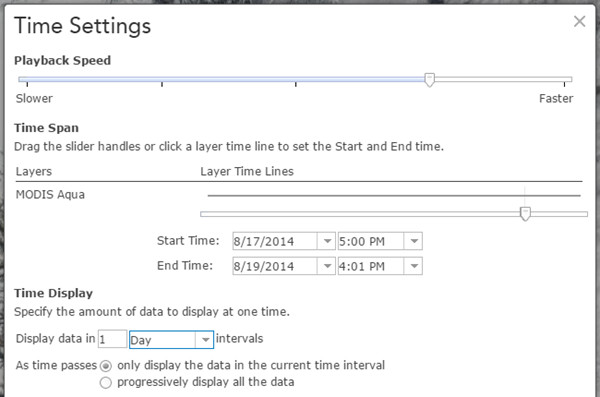
- In the time slider at bottom of map click the Configure button and “Show advanced options” and set a time interval around the date of interest (e.g., Start Time of Aug 17, 2014 and End Time of Aug 19, 2014), and then a Time Display interval of 1 Day.
Set Time Range to Find Correct Scene - You can click the Play button to animate the map and pause on the image that looks correct. Click the map to display the popup. Find the record with a Name that includes the date you want (in this case, 2014-08-18) and copy the Name value (e.g., “MA_CR_B143_2014-08-18”).
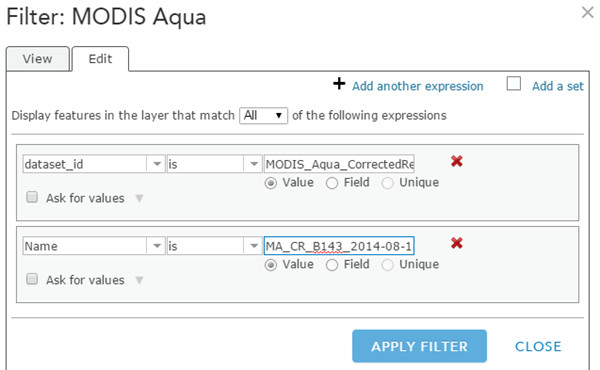
- Going back to the Content for the map, click the layer properties for the MODIS Aqua layer and select Filter. In the Filter dialog, select Edit and Add another expression. For new expression, set to be “Name is” and paste the name text that you copied and then Apply Filter.
Filter Layer by Scene Name - For the updated MODIS Aqua layer, you can now go to layer properties and Disable Time Animation and, if you like, rename the layer (e.g., MODIS Aqua on Aug 18, 2014).
- Lastly, zoom the map to the desired initial extent and Save the map with a new name of your choosing. Now you can finalize the item details for the map (e.g., edit description, thumbnail, etc.) and share as appropriate.
The above steps can be used with the MODIS imagery, including maps with different views of the MODIS multi-spectral imagery showing different band combinations (e.g., Bands 1 2 1 for Vegetation Analysis, Bands 7 2 1 for Burn Scars and Flooding). You can follow similar steps for the Landsat 8 imagery using the Landsat 8 Layers map, which also includes multiple layers revealing different band combinations.
Landsat 8 collects new scenes for each location on Earth every 16 days and the Esri-hosted maps and layers are updated on a daily basis with the latest ‘best’ scenes (e.g., limited cloud cover) from the USGS. We typically store up to 5 of the ‘best’ scenes for a given location. If a scene that you are interested in presenting is not available in the Esri-hosted image layer, there are a few options:
- Reference the scene in the USGS-hosted LandsatLook image service.
- Download the scene from the USGS LandsatLook Viewer, or other available source such as NASA’s Earth Observatory, and publish via ArcGIS Online or ArcGIS Server.
- Send a note to Esri (landsat@esri.com) with the scene ID requesting that we explicitly add it to our hosted service.
A few of the Landsat 8 scenes that were featured in NASA’s Best Images of Earth From Space in 2014 were not available in the Esri-hosted service, so I used Options 2 and 3 above to publish them. In my case, I decided to download the georeferenced TIFF images that were featured in NASA’s Earth Observatory and publish them to ArcGIS Online as hosted tile services. Below are steps I performed to do that:
Publish New Image Layer with Georeferenced Imagery
- Download the georeferenced image (e.g., GeoTIFF) and add to recent version of ArcMap (e.g., 10.1+). When asked to create pyramids, do so with an appropriate resampling technique for imagery (e.g., Bilinear Interpolation).
- Update the Layer Properties for the new layer (e.g., General info Name, Description, Credits; Symbology to show Stretch or not) and the Map Document Properties (e.g., Title, Summary, Description, Credits, Tags). The info you include in the map document properties now will be re-used in the tile layer you publish later. Save Map as MXD file.
- In ArcMap, Sign In to ArcGIS Online using an account that is part of an organizational subscription and has publisher privileges.
- Publish Map to ArcGIS Online as a Tile Service. In ArcMap File menu, select Share As Service. In the Service Editor, review and edit the settings. The key thing to edit are the Caching Levels of Detail. For Landsat 8 imagery that is 15m resolution, I’d recommend setting the cache levels with a Minimum scale level of 8 (~1:2m) and Maximum scale level of 13 (~1:72k) or 14 (~1:36k); you can preview the imagery in ArcMap at multiple scales to determine what levels you want to cache. For the Tile Format in the Advanced Settings, I would recommend MIXED for this type of imagery. Click the Analyze button to see if there are any Error or Warnings you need to address. When satisfied, click the Publish button. (Note: Some service credits will be used in ArcGIS Online to cache the imagery. If you would prefer, you can generate a tile package in ArcGIS Desktop and upload that to ArcGIS Online instead. Service credits will then only be used for file storage.)
- A new tile service will be published to ArcGIS Online and the cache will be generated, which will take a few minutes to complete depending on the volume of cache to be created. To view status and finalize the layer, you can sign in to ArcGIS.com and view the Tile Layer item that was created. One the cache is created, you can Add the Layer to a Mapto view the imagery (see below) and make any desired edits to the item description (e.g., Title).
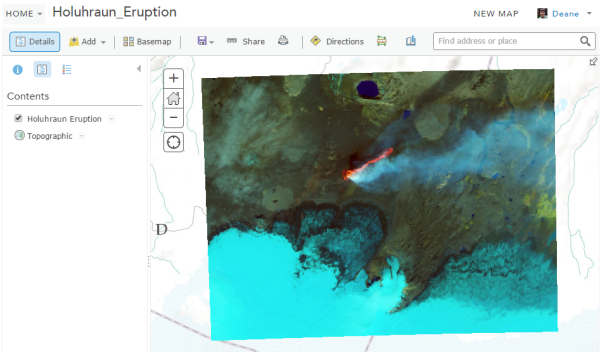
View Tile Layer in Map - Lastly, you can author a web map with the new tile layer, combining with an appropriate basemap or other layers, and save the map to be shared as a map or in an application.
A couple examples of web maps published using this pattern include the Funny River Fire, Alaska and the Roiling Flows on Holuhraun Lava Field. Both of these maps include hosted tile layers of imagery downloaded from NASA’s Earth Observatory, as well as a Map Notes layer with text for context. The Holuhraun Lava Field map also includes reference to a dynamic image layer published using Option 3 listed above (Note: To view this dynamic layer, you’ll need to first sign in with account that is part of an organizational subscription).
ArcGIS Online makes is convenient for you to create maps and apps that reference a rich collection of imagery that is included in the platform, or to publish imagery you acquire separately. We encourage you to take advantage of these content and capabilities in your work. If you create a map or app that you would like to see featured in our galleries, you can tag your publicly-shared items with ‘LivingAtlas.Candidate‘ and they will be reviewed by our curators. As always, follow best practices for sharing (e.g., attractive thumbnail, informative item details, descriptive user profile) for items you share!


Article Discussion: