(Contributed by: Owen Evans, Esri Federal team solutions engineer)
Microsoft Excel is a useful application for reviewing and manipulating data and it can also save spreadsheets as CSV or TXT files that can be published as maps on ArcGIS Online. This post contains some useful tips for getting the most out of your data using Excel.
Formatting
CSVs and TXT files are very simple formats, which mean much of the formatting supported in Excel spreadsheets is lost when you save data as one of these simple file types. For example, none of the field formatting is preserved such as numeric, currency, or text field formatting. So if you are publishing to ArcGIS Online there is no need to apply this type of formatting since it won’t have any effect in the mapping process. The next few tips relate to other formatting concerns.
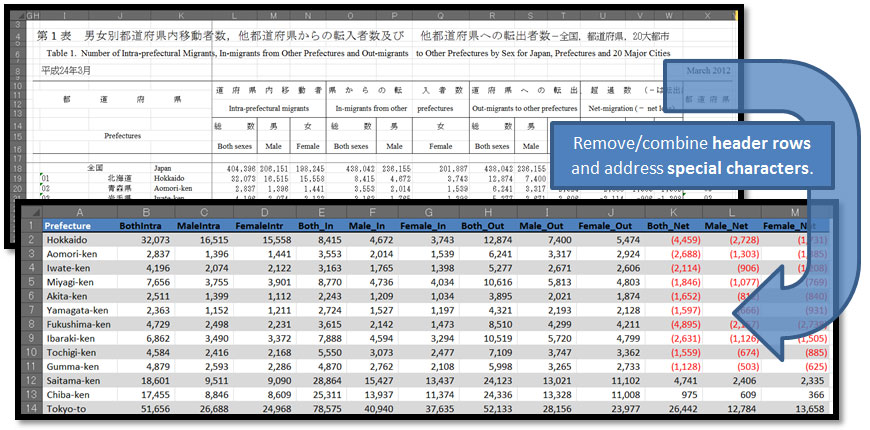
Header Rows
To map a spreadsheet it must have just one row of column names in the first row, and the data should start directly below that in the second row. The contents of the first row will be used as the names for the fields in your layer. Any blank lines, titles, or header information must be removed before the spreadsheet is saved as a CSV/TXT. Also, each column must have its own field name, so any field names that span two or more columns should be replaced with names for each field.
Special Characters
If your data contains special characters such as those in other languages like Japanese, Arabic, or Greek or other special characters like smart quotes (i.e., curvy quotation marks) you will need to either remove these characters or save your file as Unicode text for it to be interpreted correctly by ArcGIS Online. If you often deal with data that contains these characters, it may be useful to simply get into the habit of saving all spreadsheets as Unicode text files.
Spaces in Field Names
When you save a spreadsheet as a CSV a special situation may occur if you have more spaces in your field names than the number of field separators. This is somewhat rare, but if your spreadsheet fits this description you’ll need to remove some of the spaces in the field names and try publishing it again.
Formulas
Spreadsheet manipulation involves using formulas to move data or calculate cells in order to get the spreadsheet in the form you need. When you save your spreadsheet as a CSV or TXT the formulas will be lost (just like the formatting), so if you need to recreate your work or share your methodology, be sure to keep a copy of the original Excel file.
Data organization
Often when you download or receive a spreadsheet of information, the data is not arranged in a way that is easily mapped and you’ll need to do some work to make it usable. Or it may be raw data that you need to process or aggregate to visualize the data in the way you want. For example, you may need to perform some mathematical operations on several columns of data to combine them, or you may need to reorganize your data so that each row in the table represents a geographic feature. These next few tips relate to how data is arranged and organized in your spreadsheet.
Addresses
Since the summer of 2012, ArcGIS Online has supported single-line geocoding. This means that address components (address, city, state, ZIP code) can all be stored the same field or they can be in separate fields. Also, neither the order or the components nor the case make a difference in the geocoding process, so there’s typically no need to do any reformatting of address information like there might have been in the past.
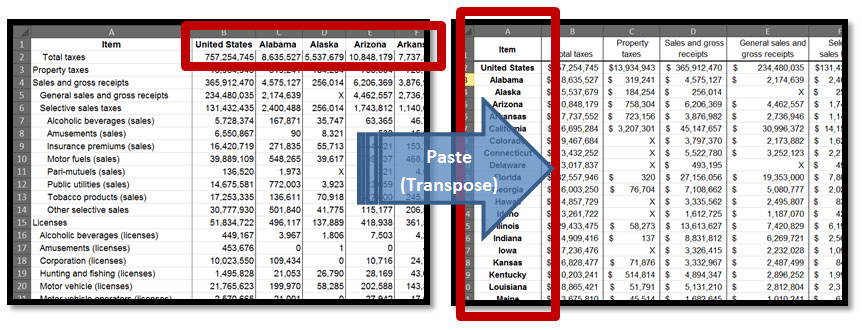
Paste and Transpose
 When mapping spreadsheets you always need your geographies represented by the rows in your table (e.g., each state’s information in its own row). A special function of the paste tool called Transpose is useful when your spreadsheet is organized in the opposite way you need it. For example, if you have state names across the top and your attributes organized in rows, you can use Paste and Transpose to flip your spreadsheet so that the rows become the columns and vice versa.
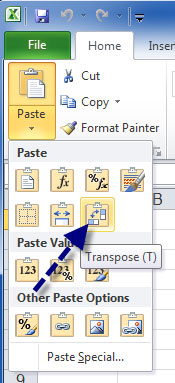
Just copy your entire table, switch to a new tab, and then Select Paste > Transpose (click the small arrow below Paste and then the Transpose icon).
PivotTables
PivotTables are very useful for aggregating, summarizing, or reorganizing your data. They provide an interactive, dynamic way of working with your data. For example, if you had several columns of data for each county in the US that you wanted to add together for your map you could use a PivotTable to do that. A further discussion or tutorial on PivotTables is beyond the scope of this post, but we’d encourage you to become familiar with this useful tool that Excel offers as it will enhance your data processing workflow for producing web maps.

Esri Maps for Office
You can use Excel to manipulate your data and then save it as a CSV/TXT and then publish it to ArcGIS Online, but an ArcGIS Online subscription also provides mapping tools within Excel via Esri Maps for Office. The Esri Maps tools enable you to publish maps directly from Excel without the need to save as a CSV or TXT file first.
You can create and save maps inside the spreadsheet file and/or share them to ArcGIS Online. If you update the data, the maps in ArcGIS Online can be updated from Excel. You can also create heat maps or use grouping or clustering in your maps (note that these features are coming soon to the ArcGIS.com map viewer). Working from Excel you can publish and register a web map and its individual layers at the same time, and Esri Maps for Office even enables you to insert a screenshot or live map into a PowerPoint presentation.
To learn more about these capabilities visit the Esri Maps for Office website.
Go to the source
Often data that ends up in a spreadsheet or CSV started its life in a database, and database systems have export tools that can generate any output you can imagine. If the data you are working with is produced and stored by your organization you may not have to settle for the form it happens to be in when you first get it (e.g., the form in which it’s shared on your public website). Talk to your DBA (database administrator) and ask him or her to export a CSV with the data arranged in the way that you want so that it can be mapped without any additional manipulation.
Database reports can summarize or combine information, generate new fields that are mathematical combinations of other fields, and utilize many other data processing functions. If the data you are working with changes, just request that the DBA save the report definition so that it can be run again when you need an updated CSV to map. Not everyone is or wants to be an Excel ninja, so be sure to utilize the resources in your organization where it makes sense.
Summary
For more information about mapping text files check out the ArcGIS Online help, especially the topic About CSV, TXT, and GPX files.


Commenting is not enabled for this article.