By Rajinder Nagi, Esri Cartographic Product Engineer
Have you ever noticed when you display a colored raster, such as elevation tints, transparently over a grayscale raster, such as a hillshaded surface, that you lose the intensity of your colors and that it is harder to see the hillshade details? This is a problem common to all software in which colors and grayshades are combined.
In this blog entry, we explain how you can overlay colored rasters on graytone rasters without losing detail in the graytones or intensity in the colors. The example here uses a colormap file and mosaic dataset functions. In a related blog entry, we demonstrate the same overlay method using color ramps and Image Analysis functions. No matter how you work with your rasters, this new overlay method will allow you to retain the detail and colors in the overlaid rasters.
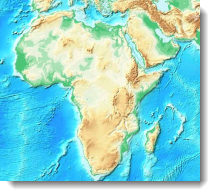
In the example below (figure 1), a layer tint with colors that relate to elevation values is overlain on a gray hillshade of the land surface. The resulting map looks washed out and relatively flat.
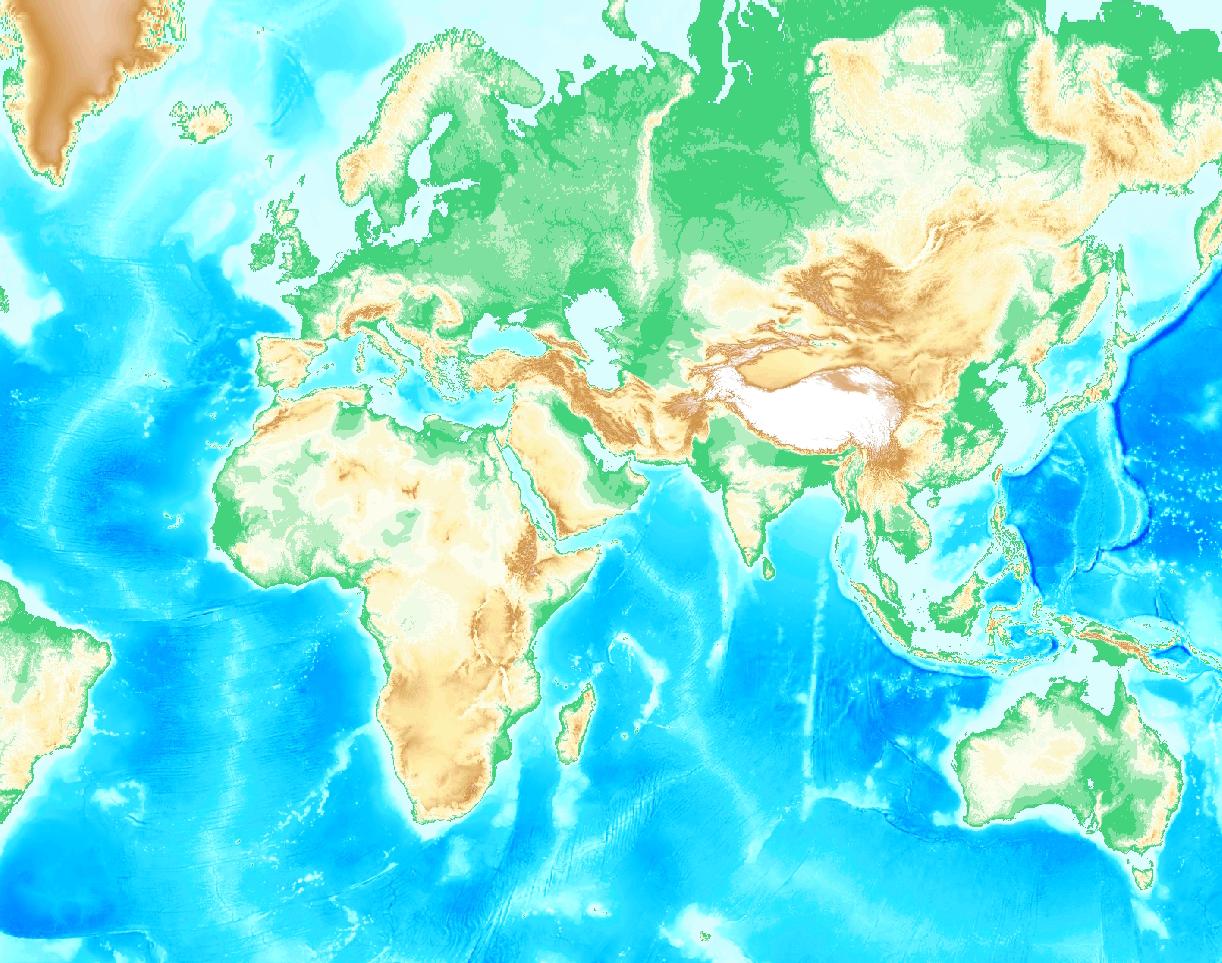
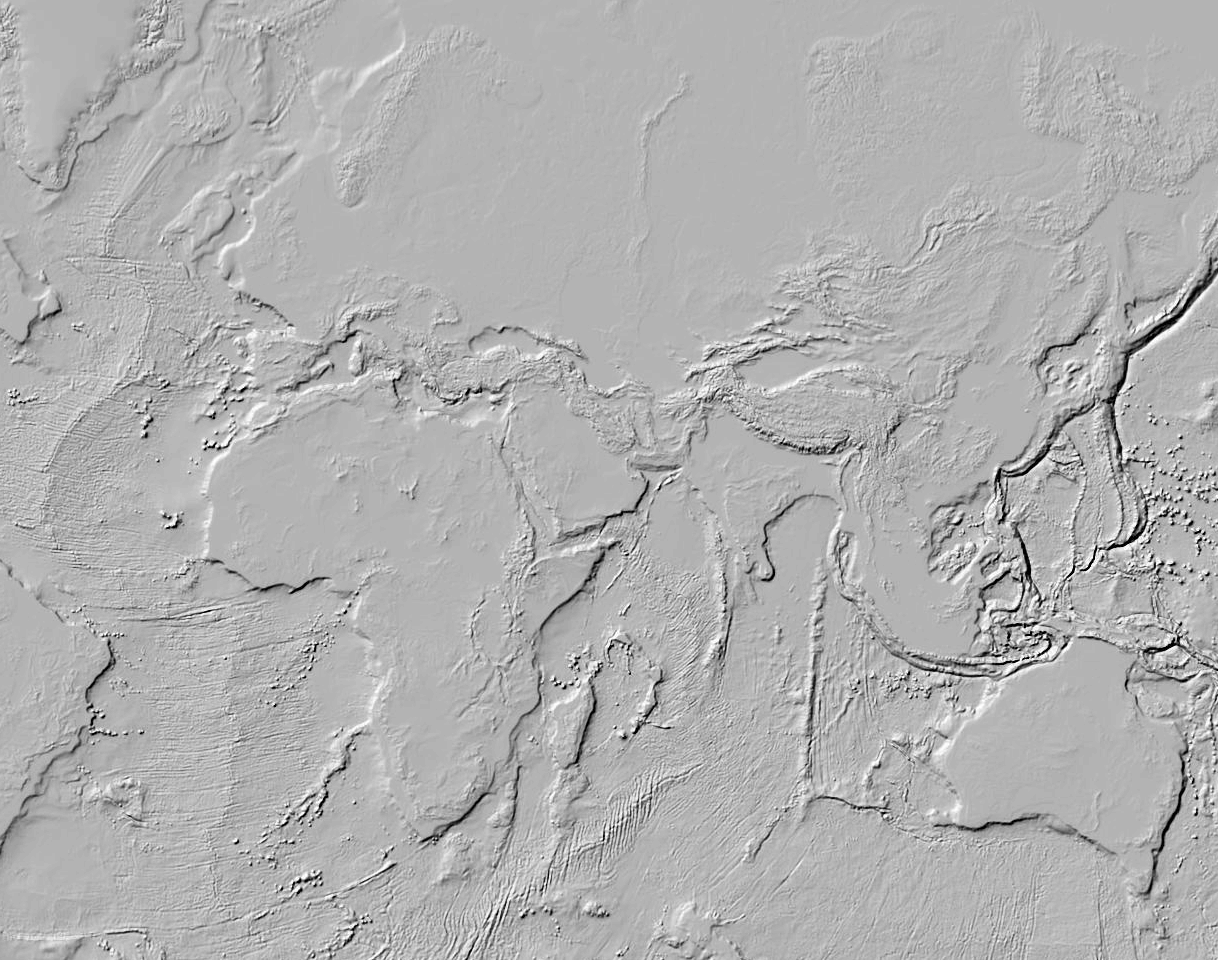
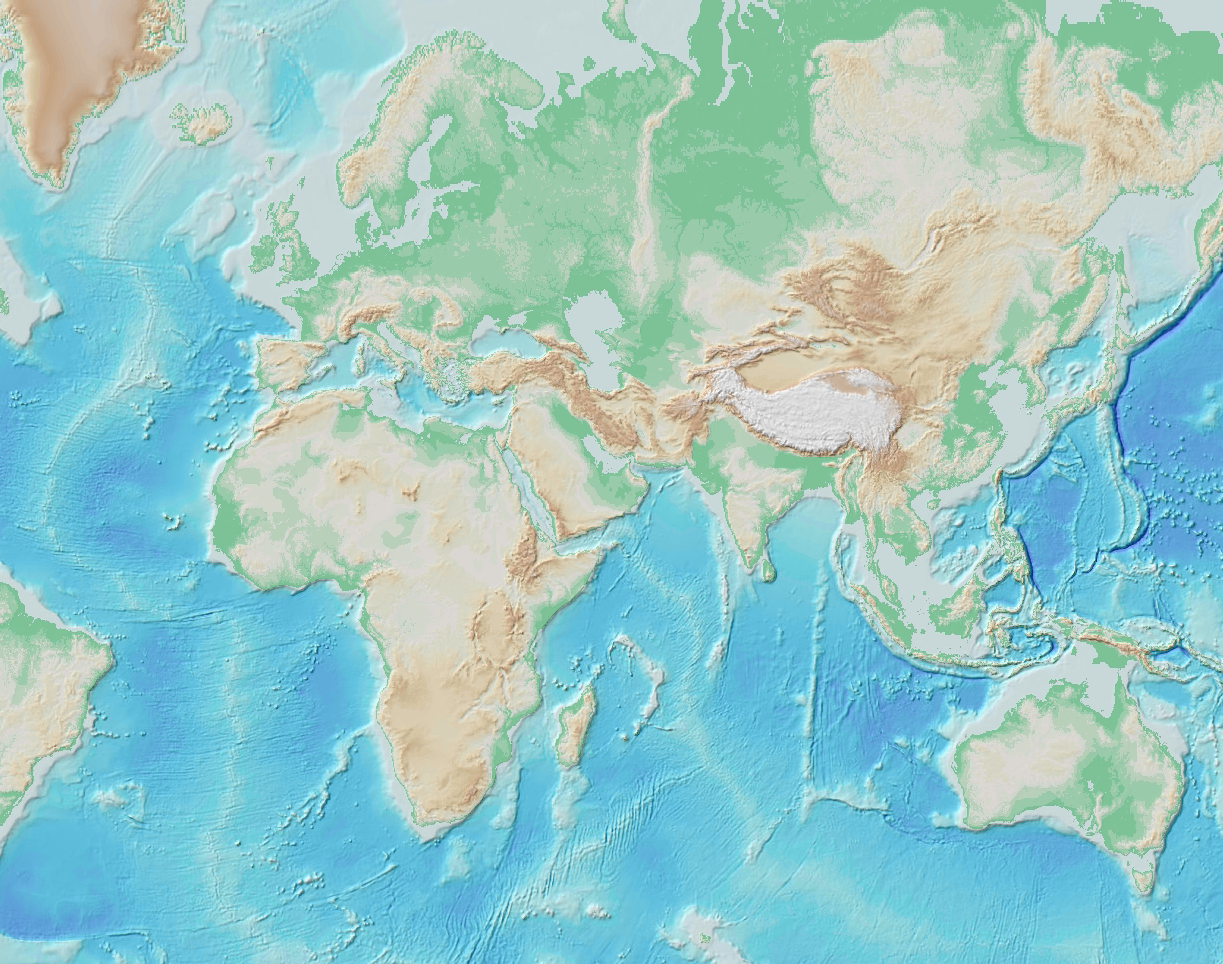
Figure 1. The first map above is a layer tint that shows elevation in different colors. The second map is a hillshade of the land surface. When the layer tint is overlain on the hillshade with 50% transparency, the colors of the elevation are washed out and the details of the hillshade are obscured.
Now there is a way you can retain your original colors and still show the detailed hillshade (figure 2). The method described uses the new mosaic datasets that were introduced in ArcGIS 10. A subsequent blog post explains how to achieve this effect with color ramps and Image Anakysis tools.
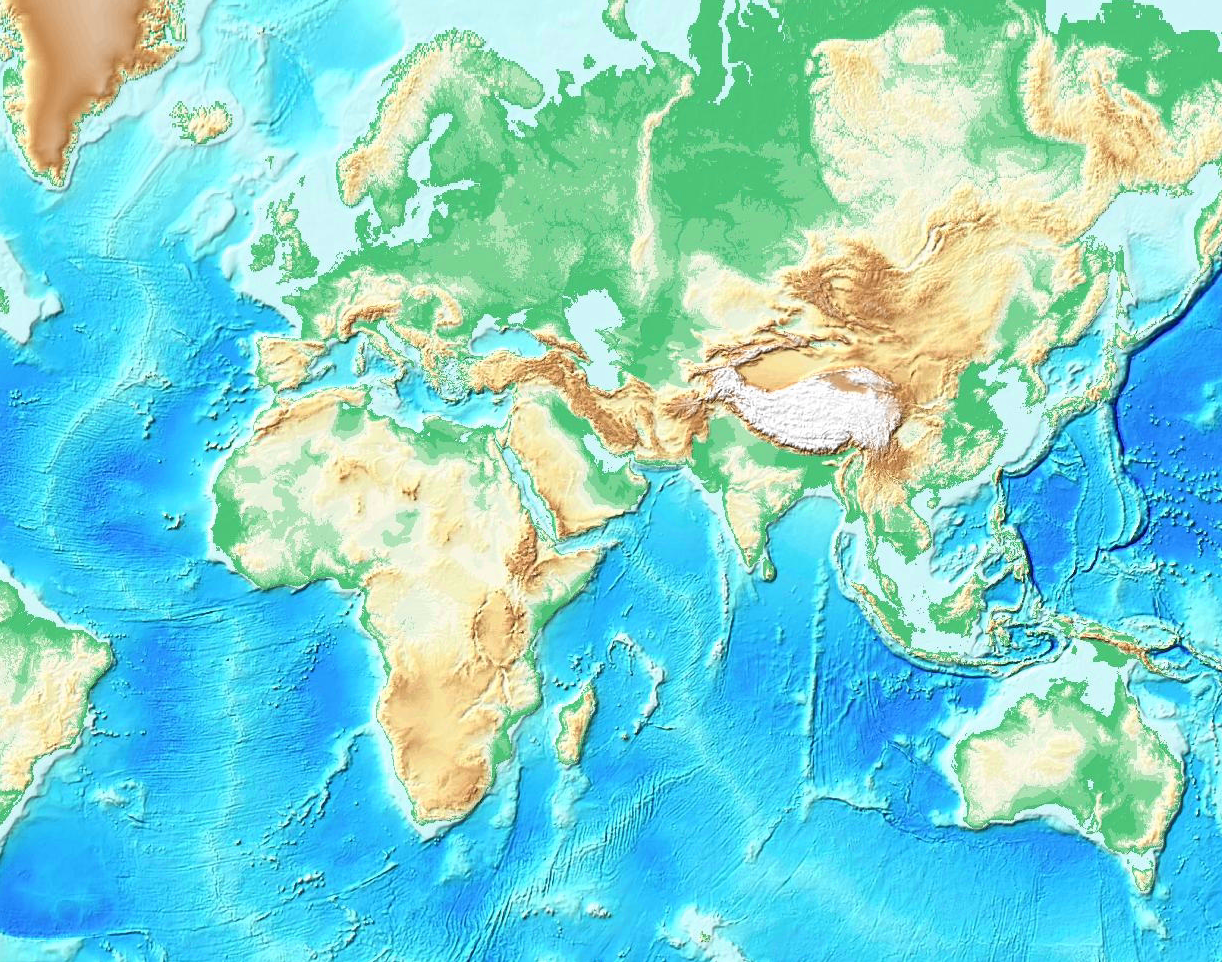
Figure 2. This map right shows how the layer tint and hillshade can be combined to retain the original colors in the layer tint and the detail of the hillshade.
Combining the layer tint and hillshade to create the desired result is a three-step process:
- Create a mosaic dataset.
- Add data to the mosaic dataset.
- Define the functions that allow the mosaic dataset to be displayed properly.
In this example, a digital elevation model (DEM) is used to create both the layer tint and the hillshade. The layer tint is rendered using a color map which is a text file that contains a color specification for each elevation value. When using a color map file in ArcGIS 10, all values must be positive – the methods we used to create the color map file and modify the DEM to satisfy this requirement are described in two related blog entries on Mapping Center: Using ETOPO1 data and Symbolizing ETOPO1 data.
Create the Mosaic Dataset
A mosaic dataset is a type of data stored in a geodatabase that allows you to manage and view collections of raster data. You can add raster data to a mosaic dataset and then modify the properties and functions used to view the data.
- Start ArcMap and open ArcCatalog.
- In ArcCatalog, create a new file geodatabase by right clicking the folder for the new geodatabase and selecting New > File Geodatabase.
- Rename the geodatabase.
- Right click the geodatabase and click New > Mosaic Dataset.
- Input a name for the mosaic dataset and set a coordinate system. In this example we used the Robinson projection for the world.
- Click OK.
- The mosaic dataset will appear under the file geodatabase in ArcCatalog and a new layer will appear in the table of contents (figure 3).
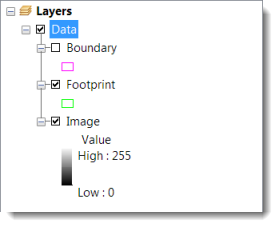
Figure 3. The mosaic dataset in the table of contents.
Add Data to the Mosaic Dataset
- In ArcCatalog, right click the mosaic dataset and click Add Rasters.
- Keep the default Raster Type as Raster Dataset, then click the browse button to input the raster dataset, and navigate to select the raster data you want to add.
- Click OK.
Define the Functions for the Mosaic Dataset
- In ArcCatalog, right click the mosaic dataset and click Properties.
- On the Functions tab, right click Mosaic Function > Properties.
- On the General tab of the Mosaic Dataset Properties dialog change the Output Pixel Type to 16 Bit Unsigned.
- Click OK.
- On the Functions tab, right click Mosaic Function > Insert > Colormap Function.
- Browse to the colormap file. (Note that you can download a colormap file for ETOPO1 and other elevation data from Mapping Center.)
- Right click Colormap Function > Insert > Colormap to RGB Function.
- On the General Tab, change the Output Pixel Type to 8 Bit Unsigned.
- On the Functions tab, right click Colormap to RGB Function > Insert > Pansharpen Function.
- For Panchromatic, select the hillshade, if you have one. If you do not, select the DEM.
- Change the Method as Simple Mean.
- Keep the rest of the defaults and click OK.
- If you do not select a hillshade in step 10, right click the DEM > Insert > HiIlshade. Keep the defaults and click OK. (If it is not projected, change the Z-factor according to the values in this entry: Setting the Z Factor Parameter Correctly.)
- Right click the Pansharpening Function > Insert > Stretch Function.
- Change the Type to Minimum-Maximum.
- Check the option to Use Gamma.
- Input 0.5 as the Gamma value for each of the three bands.
- Input 10 and 220 as the Min and Max Statistics values for each of the three bands. (After you have checked the results, feel free to experiment with these Gamma, Min, and Max values in the Stretch Function.)
- Click OK.
- To see the results in the ArcMap window, right click Footprint in the table of contents > Open Attribute Table, right click the MaxPS field, and click Field Calculator.
- For “MaxPS =”, input [MaxPS] * 10000 and click OK. (For more information about what scalar value to use in this equation, read the online help topic Cell size ranges in a mosaic dataset.)
- Close the attribute table.
The final function chain will look like figure 4.
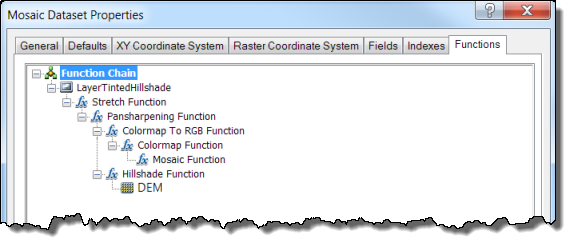

Figure 5. The final results.
This method of displaying hillshade and layer tints produces a result that retains the fidelity of both the rasters. The same method can be applied to any colored raster combined with a grayscale raster.
Intrigued? Want to know technical details behind this method? Here is the full paper: Maintaining detail and color definition when integrating color and grayscale rasters using No Alteration of Grayscale or Intensity fusion method


Commenting is not enabled for this article.