Introduction
Bacterial contamination is the leading cause of water quality impairment in Texas waters. Many of these bacterial impairments are along the Texas Gulf Coast because coastal waters often are regulated for oyster harvesting, which requires strict water quality standards. Per the US Environmental Protection Agency’s Clean Water Act, each of these impaired waterbodies requires a Total Maximum Daily Load (TMDL) study to be performed. TMDL Balance is a steady state, mass balance, GIS-based model for simulating pollutant loads and concentrations in coastal systems. Through use of the schematic processor, the model passes pollutant loads through the system, accumulating and decaying the loads as they move along through a series of processing ops.
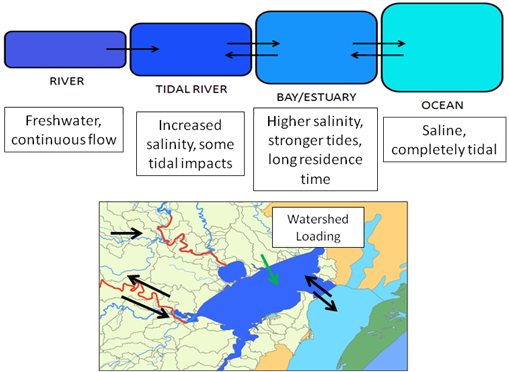
The TMDL Balance model was developed and applied in the Copano Bay watershed of southeast Texas. The model is used to simulate bacterial loading, decaying these loads as they move via overland flow and through three distinct types of waterbodies: freshwater non-tidal rivers; tidal rivers; and bays/estuaries. Though the model was developed in the context of modeling bacteria TMDLs along the Texas Gulf Coast, it is applicable to a variety of pollutants and geographic areas.
Defining the Flow Network
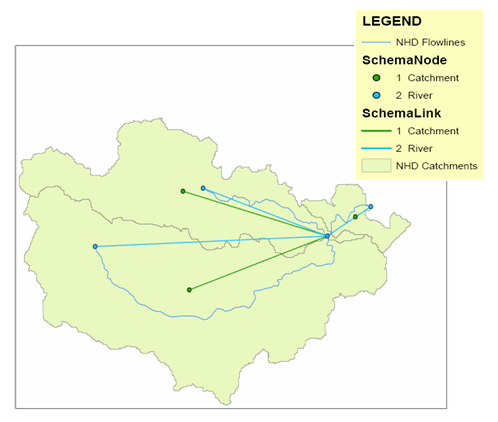
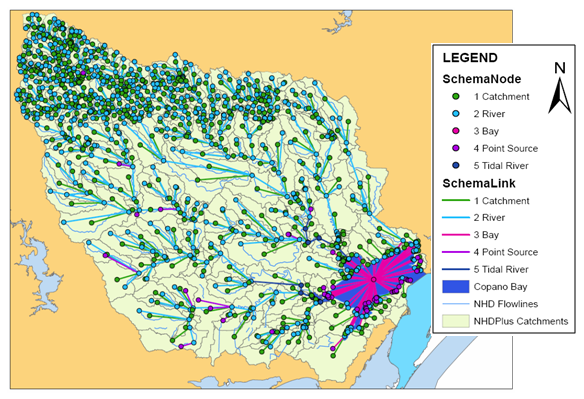
The schematic network is the framework upon which the TMDL Balance model (through the schematic processor) performs its calculations. Representing hydrologic features on the landscape through a series of links and nodes, schematic networks are built from river and catchment features using the Arc Hydro Tools. Nodes represent catchments, river headwater locations and river junctions. Links are created to connect the river headwater locations and junctions to create the river network and to connect catchment nodes to the river network.
To model bacterial loading in coastal systems, additional nodes and links are needed. The nodes represent the bay/estuary, itself, and point sources that add bacteria into the system. In the Copano Bay watershed, point sources include wastewater treatment plants, colonies of birds nesting adjacent to the Bay and failing septic systems adjacent to the Bay. After manually adding the nodes, they are connected to the network through the use of links. One last manipulation to the schematic network is the differentiation of tidal from non-tidal rivers. Water quality processes in the two river types are simulated differently; therefore, they must be differentiated in the schematic network. In the Copano Bay example, the location of tidal rivers was defined by regulation.
Computing Loads
Bacterial load is added to the system at each catchment and point source node. Loading from the catchments represents non-point source loading and is computed as a function of the various non-point sources in that geographic area (determined as a function of land use/land cover and a number of other resources) and the computed mean annual runoff. Point source loads are computed as the product of bacterial concentrations (measured or estimated) in the point source flow and the mean annual flow amount. In the Copano Bay watershed non-point sources of bacteria include: agricultural animals, wildlife, natural background and failing septic systems away from the Bay.
Simulating Water Quality
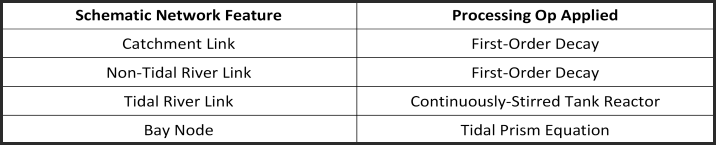
TMDL Balance uses a series of processing ops to simulate water quality, including tidal interactions and bacterial decay. These ops include: first-order decay (overland flow and non-tidal rivers); continuous stirred-tank reactor (tidal rivers); and the tidal prism approach (bays/estuaries). The ops are implemented throughout the network using the schematic processor. The ops are applied to the nodes and links, depending on the features that they represent. Any feature not specifically assigned a processing op is simulated using the schematic processor’s default operation of simple accumulation.
Computing the TMDL
Once the bacterial loads are assigned to the schematic network and the model has been calibrated to observed values, the model can be used to compute the maximum load that can enter the system’s waters while still meeting water quality standards (i.e., the TMDL). Simulating reductions within the watershed can then inform implementation activities.
Special thanks to Dr. Stephanie Johnson for contributing this blog. The TMDL Balance model was developed by Dr. Johnson, and for information on the model or its use contact Stephanie at sjohnson@houstoneng.com.


Commenting is not enabled for this article.