By Aileen Buckley, Mapping Center Lead
In a previous blog entry called “Using the Global Self-consistent, Hierarchical, High-resolution Shoreline Database“, we described a detailed and useful worldwide dataset — the GSHHS dataset that provides global coverage at five levels of generalization for oceans/land, lakes, islands in lakes, and ponds on islands in lakes.
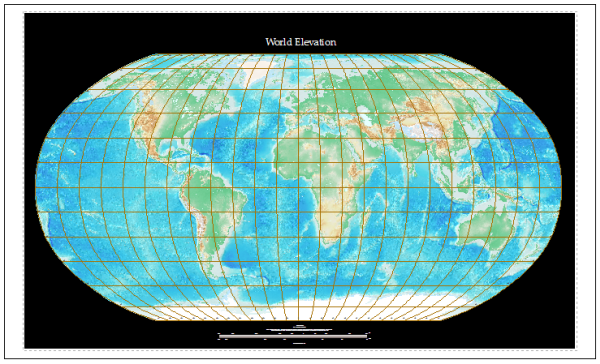
In this blog entry, we describe another really great global dataset — the ETOPO1 Global Relief Model. At last year’s Esri International Users Conference in the “Making Beautiful Maps” technical session presentation, which you can download from our Other Resources page, we demonstrated how well these two data sets work together. Both were used in the World Elevation (figure 1) and World Landform maps, as well as the Pacific Northwest map.
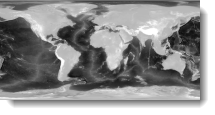
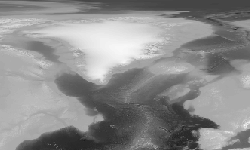
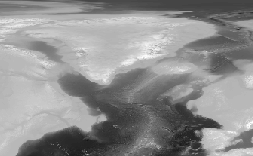
ETOPO1 is a dataset that was released by the National Oceanic and Atmospheric Administration (NOAA) in 2009. It’s a 1 arc-minute global digital elevation model (DEM) of the Earth’s surface that includes both land topography and ocean bathymetry. An arc-minute is equal to one sixtieth of a degree which results in a grid cell resolution of about 1.8 km. This is a higher resolution dataset than the older ETOPO2 (about 3.7 km) and ETOPO5 (about 9.3 km) data sets. There are two versions of ETOPO1 data: “Ice Surface” (which includes the elevation at the top of the Antarctic and Greenland ice sheets) and “Bedrock” (elevation at the base of the ice sheets). You can see the differences between these if you examine the ice covered areas of Greenland in the images below.
Below, I’ve outlined the steps I used to download the data from NOAA and process it for use in ArcMap:
- Go to the ETOPO1 Web site (http://www.ngdc.noaa.gov/mgg/global/global.html).
- If you want the ice surface data, save the following file to a directory on your computer and then unzip it:
- ETOPO1 Ice Surface > grid-registered > binary > f4 format
- http://www.ngdc.noaa.gov/mgg/global/relief/ETOPO1/data/ice_surface/grid_registered/binary/etopo1_ice_g_f4.zip
- If you want the bedrock data, save the following file to a directory on your computer and then unzip it:
- ETOPO1 Bedrock > grid-registered > binary > f4 format
- http://www.ngdc.noaa.gov/mgg/global/relief/ETOPO1/data/bedrock/grid_registered/binary/etopo1_bed_g_f4.zip
- In ArcGIS, use the Float to Raster tool (in the Conversion Tools toolbox in the “To Raster” toolset) with the downloaded and unzipped file as the input floating point raster file. Specify the output file to be placed in a file geodatabase of your choice. This step will also convert the data to the right format to be used with a color map file (which we will discuss in a subsequent blog entry Symbolizing ETOPO1 Data).
- Use the Define Projection tool (in the Projections and Transformations toolset of the Data Management toolbox) to define the projection using a Geographic Coordinate System -> World -> WGS 1984 projection.
Here is the citation that NOAA requests you use if you have included the data on your map:
Amante, C. and B. W. Eakins, ETOPO1 1 Arc-Minute Global Relief Model: Procedures, Data Sources and Analysis. NOAA Technical Memorandum NESDIS NGDC-24, 19 pp, March 2009. Go to this web site: http://www.ngdc.noaa.gov/mgg/global/global.html.
Once you have downloaded and processed the data, you are ready to display it on a map. Look for our subsequent blog entry about Symbolizing ETOPO1 data to see how this can quickly and easily be done – with beautiful results!
Thanks to Ken Field and Mark Smithgall, cartographers on the Esri Mapping Center Team, for their help with this blog entry!


Commenting is not enabled for this article.