Park analysis and design: Locating a park through suitability analysis (part 2)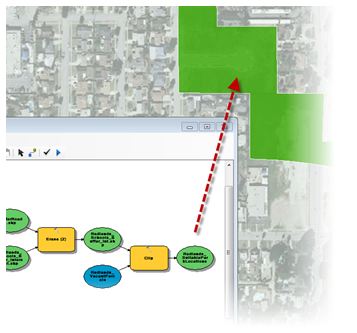
In my previous blog post, I analyzed park accessibility in the City of Redlands and discovered several areas of the city that were farther than one mile from an existing park along the walkable street network. Now, I want to determine where to best locate a new park within the areas I identified as being underserved by current parks.
To answer this question, I’ll conduct a suitability analysis to find parcels that are most appropriate for a new park.
There are two main types of suitability analysis: binary and weighted. Binary suitability analysis involves a binary final answer —1 or 0, or in our case, suitable and unsuitable. A weighted suitability analysis allows for a range of final answers, from 1 to 10, for example, and allows certain layers to have more influence (weight) on the result of the model. For this example, I’m going to create a binary suitability analysis model.
As with our park accessibility analysis, I’ll start with several datasets from the City of Redlands, including parks, schools, roads, trails (off-road and on), existing and proposed bicycle lanes, and vacant parcels. Before I construct a model, I should know the distances the new park should be from certain features. In most cases, I’m looking to be close to certain features, but in other cases, I want to make sure I’m far enough away, such as with highways and existing parks. 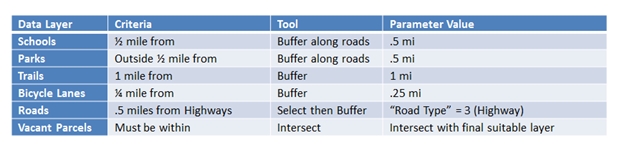
Remember that any of these values can be changed to suit any criteria. ModelBuilder allows a workflow to be created, run, and then modified to suit different ideas of how far each feature should be from a new park.
Creating a data processing workflow
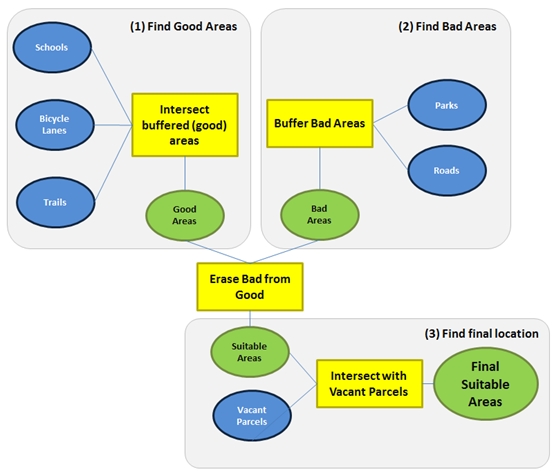
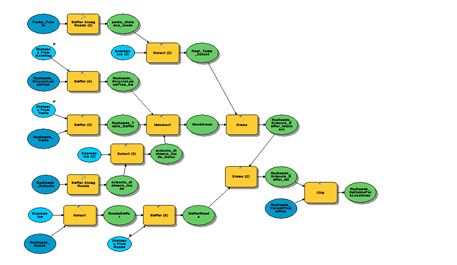
My analysis should read like a flowchart: buffer the schools, trails, and bicycle lanes to make the ‘good’ areas. Buffer the existing parks and highways to make the ‘bad’ areas. Then remove the bad areas from the good areas, and find the areas that are common to the vacant parcels.
Developing a suitability model
To use the data and tools found in ArcGIS to accomplish suitability analyses, I’ll develop a model using ModelBuilder. ModelBuilder acts much like a living flowchart, with data elements connecting to tools creating outputs just like the flow processing diagram. A model serves not only as an organizational tool for doing data processing, but the elements of the model store parameter values and data paths that can be changed, and the model itself can be shared and run on different data. For example, other users can change the input datasets to their own parks and street network to achieve the same analysis.
By definition, geoprocessing tools take one or more pieces of geographic data, run a process based on parameters I define, and create a new piece of data as the result. That first result can be fed into another tool which results in yet another piece of data. Once the new data has been created, the old result can be discarded. This data is called intermediate data. Each piece of intermediate data should be written to a scratch workspace, which is defined in the environment settings of the map or model. Keeping intermediate data in a scratch workspace is a great way to ensure I don’t end up with random datasets all over my computer.
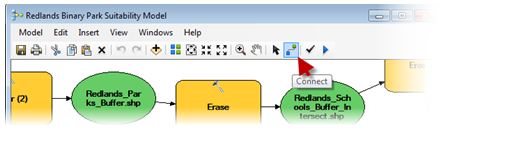
Tools for models can be found using the Search window. The Search window will allow me to type in the name of a tool, dataset, or script and show results across all types of data. To add a tool to a model, drag the tool by its name, and drop it on the model canvas. Model elements can be connected using the Connect tool from the model window. Double-clicking a tool or element will open a dialog box that allows me to ensure the settings are correct before I run the model. ModelBuilder will also check the inputs are valid before running, and I can check them all manually by clicking the Validate Entire Model tool from the ModelBuilder toolbar. I can save the model in a toolbox, which can be stored anywhere on disk or in a geodatabase, as I am doing.
When the model runs, a dialog box shows me the progress, notification that it is finished, and any messages, warnings, or errors that might have occurred. The Results window is the location to track the status of a model or other geoprocessing operation.
Reusing models as tools
Another nice feature of models is they can be used in other models as tools. Since I already proved the effectiveness of measuring distances along the road network versus straight-line buffers, I can 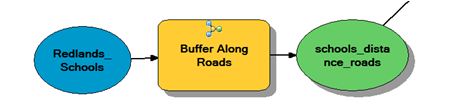 take the method I developed and use it as a tool in my park suitability model. I’ll call the tool Buffer Along Roads and use it for the schools and existing parks, which are the only datasets that require travel to be measured along the road network.
My model tool will operate as any other tool: it requires an input point dataset and will create a polygon dataset containing buffers along the roads using the distances exposed in the reclassification scheme. Once I’ve created these distance polygons, I then choose the ones that meet my criteria—in this case those that are ½ mile from existing parks and within ½ mile of schools. From there, the rest of my analysis can continue using straight-line buffers from bike lanes, trails, and highways.
Determining the final location
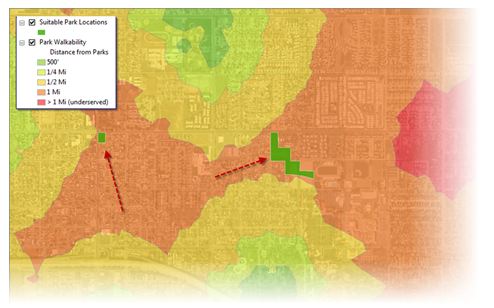
When the model is finished, I see that there is more than one suitable location for a new park. I then have some work to do to figure out the final parcel or location. For example, perhaps I’m looking for the area that is closest to downtown. Using my park access analysis as an example, converting the final suitable polygons to points and running them through a cost distance tool would be one method to use.
However, I want to allow the citizens to provide input. In the next entry in this series, I’ll use ArcGIS Server to collect volunteered geographic information, crowd-sourced, or user-generated content to allow users to vote on their favorite location for a new park. This concept is now being referred to as “participatory planning”.
Accessing the data and models
The data and models for this blog post can be found here
The rest of the data and tools for this blog series can be found in the Park Analysis and Design group here (make sure to filter by Show: All Content at the top of the page)
Update
Part 1 – Park analysis and design – Measuring access to parks
Part 2 – Park analysis and design: Locating a park through suitability analysis
Part 3 – Park analysis and design: Voting on a new park location
Part 4 – Park analysis and design: Sketching the design of a new park
Content for the post from Matthew Baker

Commenting is not enabled for this article.