In last week’s post, Creating and Animating Water Level Maps with Arc Hydro Groundwater – Part 1, we showed how to automate the process of creating and animating water level maps using a combination of standard ArcGIS tools and a few of the Arc Hydro Groundwater (AHGW) tools. We also provided an animation of water levels for the Edwards Aquifer in Texas. One of the interesting features of this animation is the animated water levels shown along a cross section of the aquifer.
In today’s post we will cover how the cross section was created and water levels added to it.
Step 1 – Create a new section line
The first step in the process is to sketch a cross section of interest. We store the cross section in the SectionLine feature class (part of the AHGW data model) and give it a unique identifier and name (the unique identifier of the section line will later be used to reference any cross section features related to the section). Also, a vertical exaggeration is assigned to the section line (in this case a value of 20 was used); this value will be used to vertically scale features when creating the cross section. The following figure shows section line A-A’ sketched from East to West across the Edwards Aquifer boundary. A set of wells with hydrostratigraphy data are also shown. Data from these wells will be added to the cross section.
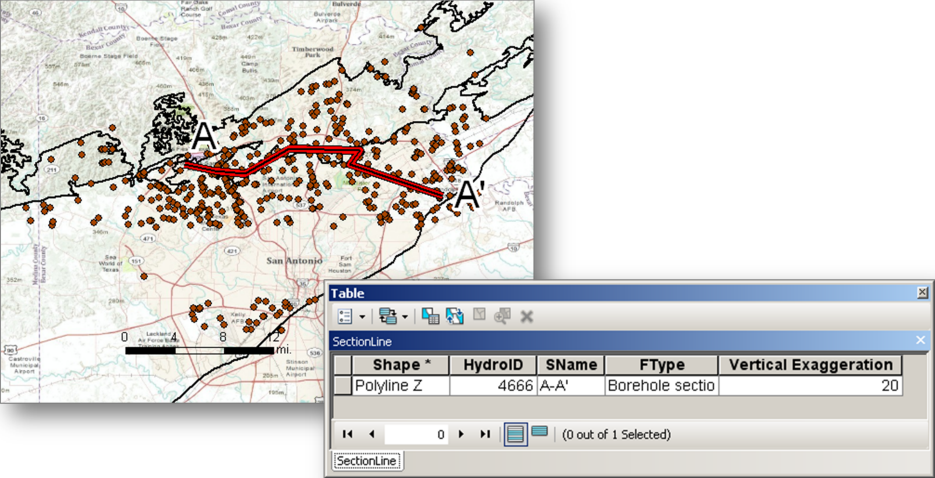
Section Line A-A’ and wells with hydrostratigraphy information. Notice the HydroID (unique identifier), SName (section name), and vertical exaggeration attributes assigned to the section line.
Step 2 – Borehole information
Borehole hydrostratigraphy data was imported into the BoreholeLog table. This table stores vertical borehole data, in this case data describing the hydrogeologic units along the bores. Each item in the table represents an interval along a borehole. The WellID references a Well feature which gives the XY location and the TopElev and BottomElev give the vertical dimension of the interval. Material, HGUID, and HGUCode provide descriptive information of the strata and the hydrogeologic units.
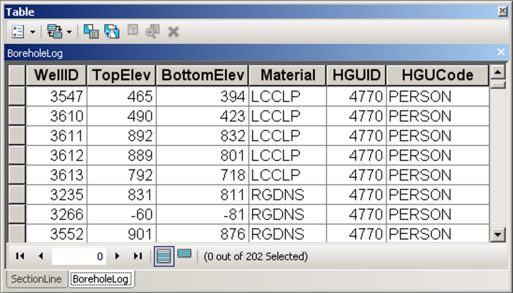
BoreholeLog table for storing vertical information along boreholes.
Step 3 – Creating a new cross section data frame and feature classes
Using the XS2D Wizard available as part of the AHGW tools, we created a new data frame and a set of feature classes for displaying information along section A-A’. The new feature classes that were created include (notice that all cross section feature classes get a XS2D prefix to indicate they are part of a cross section) features representing grid lines, panel dividers, and borehole stratigraphy.
We also used the Transform Raster To XS2D Line tool available in Subsurface Analyst to add a line representing the surface terrain from a DEM.
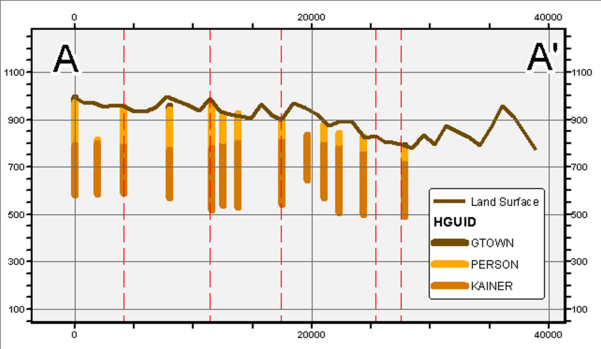
Data frame for representing cross section A-A’. Red lines represent panel dividers (point along a section line where the cross section changes direction), the colored thick lines represent hydrostratigraphy at bores along the cross section, and the brown line represents the land surface.
Step 4 – Adding water levels to the cross section
In Part 1, we demonstrated how to create and animate a set of rasters representing the water levels at different time periods. To add water levels from the rasters to the cross section we batch processed the Transform Raster To XS2D Line tool.
The tool:
- takes as input SectionLine features and raster datasets,
- reads values from the raster along the section lines at a specified sampling distance,
- and then applies a transformation such that the raster data can be displayed in the cross section data frame.
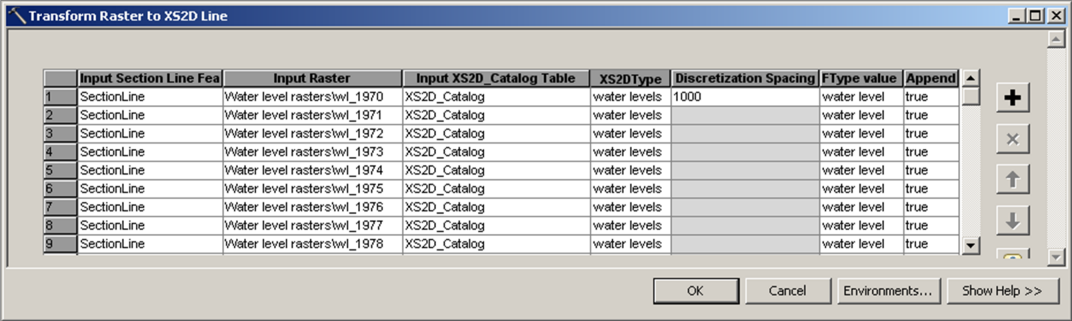
Lines representing water levels along the cross section were derived using the Transform Raster To XS2D Line tool.
The result is a set of line features that represent the raster data. In our case each line represents the interpolated water levels for a given time period. We added a Tstime field to the output line features and added a time stamp so the water level lines can be animated over time in coordination with other datasets (points, rasters, and contours) in the plan view data frame. The following figure shows the derived water level lines for all time steps displayed in the cross section data frame.
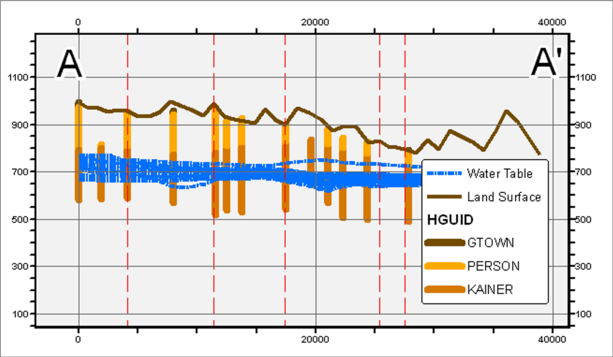
Line features representing the water table at different times. The lines can be animated in coordination with other datasets describing water levels (points, rasters, and contours).
If you haven’t see the final animation yet, take a look at the final result.
For more information on Arc Hydro Groundwater, visit the Hydro Resource Center Groundwater page, Education gallery, or
![]()
Special thanks to Gil Strassberg and Tim Whiteaker for providing this post. For more information contact Gil (gstrassberg@aquaveo.com) or Tim Whiteaker (twhit@mail.utexas.edu).


Commenting is not enabled for this article.