By Aileen Buckley, Mapping Center Lead
We got a question on Ask a Cartographer the other day about declination diagrams:
“I have a need to create a declination diagram for a map I am creating in ArcInfo (9.3.1). Is there a tool available that I don’t know about in ArcGIS Desktop to do this? If not, what would the best procedure be to create this map element?”
First, here is a short excerpt from Map Use, Sixth Edition about these map elements:
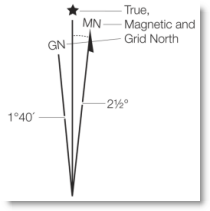
A declination diagram is ‘…a diagram that shows the angular relationship, represented by prongs, among grid, magnetic, and true norths…Notice that the true, magnetic, and grid north reference lines are marked at the top with a star, the letters “MN” and an arrow, and the letters “GN”, respectively’, as shown in figure 1 (taken from the Madison West, Wisconsin, USGS 1:24,000 quad.)
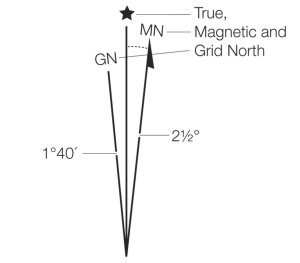
Figure 1. Declination diagram showing relations among true, grid, and magnetic north reference lines on the Madison West, Wisconsin, USGS 1:24,000 quadrangle. (Figure from Map Use, courtesy of Esri Press.)
If you have the PLTS extension, you can add as a surround element a United States Geological Survey (USGS)-style declination diagram. If you do not have PLTS, you can create this as set of graphic elements in ArcMap.
First it is helpful to know that when you insert a north arrow onto a page in ArcMap, it will always align to grid north of the data frame – in other words – your page! This is determined using the orientation of the data frame – not the data or the projection. So a north arrow is only correct in ArcMap when true north is aligned to the meridian at the center of the map and that meridian is straight up and down – which is generally not the case. If you want the north arrow to indicate properly true north for the entire map area, then all the meridians have to be parallel to the sides of date frame. That is, they have to be rectangular in shape with an orthogonal graticule, as with the Mercator, Miller Cylindrical, Plate Caree’, Web Mercator, or Cylindrical Equal Area projections, for example.
Our north arrow is really pretty much a graphic primitive – it indicates the direction of increasing northings which will always be the same for the entire map. A northing is the y-coordinate direction measured north from the origin in a grid coordinate system. And the grid coordinate system that is used to determine the northings for the north arrow in ArcMap is the coordinate system of the data frame. That’s why you can put a north arrow anywhere on your map and it will always point in the same direction – towards the direction of increasing northings. And this will always be in the direction of the data frame’s rotation angle.
True north on the declination diagram is always aligned to the meridian at the center of the mapped area.
Magnetic north is something that you would need to define (or compute using something like the World Magnetic Model at http://www.ngdc.noaa.gov/geomag/WMM/DoDWMM.shtml). Again the magnetic declination would relate to the center of the mapped area.
Grid north would be the same as the coordinate system of the data frame if that is the primary grid you are showing on the map. If you are showing something different (e.g., a USGS topo quad might use a State Plane projection but the grid that is shown is UTM), then grid north aligns with the easting at the center of the mapped area. OR (e.g., a USGS topo quad might use a State Plane zone for its coordinate system but the grid that is shown is UTM), then grid north aligns with the easting line of that grid at the center of the mapped area.
To create the lines for true north and grid north, you’d set the data frame properties to include two grids: 1) the graticule, and 2) a measured grid that is the same as the grid you want to use for your map. You’d draw a graphic line that aligns with the meridian at the center of the mapped area as a thin black line. Add a star at the top of this line to designate it as true north. You’d add another thin black line that aligns with the measured grid’s easting at the center of the mapped area. Although you would draw these lines in the middle of the mapped area, you will move them off the map and into the margins later.
You need to add the magnetic north line as well. Draw this as a think black line with an arrowhead at the end. At this point, you need to change its angle to whatever the value for your map would be. Now you run into a problem. The Rotate tool on the Drawing toolbar does not allow you to input a value – you can only rotate it freely. This would be a problem except for the fact that the diagram is just an illustration anyway; it is meant for map reading, not analysis! Here is another excerpt from Map Use:
“Don’t measure the angles on the diagram with a protractor as small angular differences are often exaggerated on the declination diagram to make them more discernible.”
So, this means that you can use the Rotate tool to approximate the angle of magnetic declination. In fact, you can approximate the angle for the grid north line, too — as long as the relationships in the declination diagram are correct relatively and the exaggeration is not too great!
Finally, you need to add the text to indicate which line is grid north (“GN”) and which is magnetic north (“MN”), as well as the amount of declination for each. Now group all the graphic elements and move the complete declination diagram to its proper location on the page.
The bottom line is this – a declination diagram is a graphic that is meant to show the map readers the relative relationships between grid, true and magnetic north. As such, it can be approximate. Additionally, with the revelation of the way that a north arrow works in ArcMap, we suggest you insert your north arrow as a marker symbol and rotate it manually to the angle of a meridian to show the direction of true north. Of course, if the meridians that span the extent of your map are not all nearly parallel (so that true north is in the same direction across the extent of the map), then you should either: 1) not use a north arrow, or 2) place it along a meridian, perhaps in more than one location to show people that the meridians indicate true north. And if you use a compass rose (or any north arrow symbol that shows both north-south and east-west), then you should place it at the intersection of a parallel and a meridian (again, perhaps in more than one location.)
Note: There is an enhancement request submitted to add the ability to insert a magenetic north arrow to a page layout: “NIM003340: Request ability to add a North Arrow representing magnetic north”; however, it is currently marked as deferred. (The bug/enhancement will be considered for a future release. Development reconsiders all deferred issues at the beginning of each release cycle.)
Please feel free to make your voice heard by submitting an Esri Support Services support request to have your customer information added to the enhancement or contact your regional local distributor for those customers located outside the United States: http://support.esri.com/index.cfm?fa=homepage.requestSupport.gateway.
Thanks to Melita Kennedy, Senior Product Engineer for Map Projections and Datum Transformations, and David Barnes, Senior Product Engineer for Page Layouts in ArcMap for their help on this blog entry.


Article Discussion: