By Aileen Buckley, Mapping Center Lead
We recently got a question on Ask a Cartographer that related to the use of a restricted color ramp. The person asked, “Is there an easy way that I can make all the counties in one state variations on one hue, but each state a different colour so that the map readers can easily distinguish between states and counties?” The solution is a restricted color ramp and it can be used in many different situations. For example, on this web site it is used to differentiate the various world regions (not exactly continents as Japan is a separate region and most of Indonesia is grouped with Australia) for a set of cartograms: http://www.newscientist.com/gallery/dn15041-the-atlas-of-the-real-world/1.
We used this technique on a map with trees to create just a little variation in greens, as shown below (the presentation we gave on this is also available for download on the Other Resources – Presentations page – it is the NACIS 2007 one called “Creating Landmark Maps with GIS”):
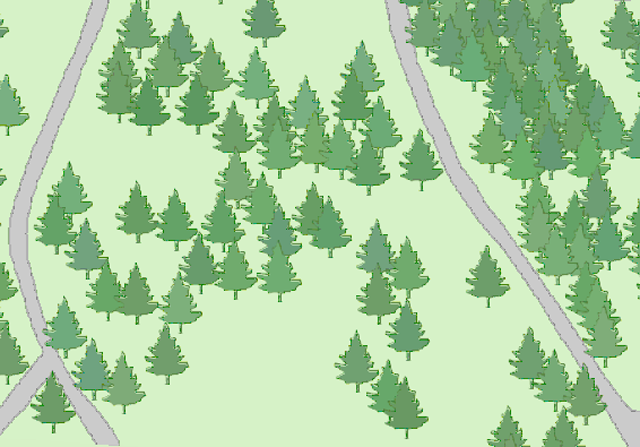
For the map above, we were using Categories to show Unique Values, which is probably similar to what you would use for states and counties. Whereas we applied the variation in color to all the features in the feature class, for the state/county map you would have to do this separately for each state. There are a number of ways you can do that – for the sample map at the end of this blog entry, I created a new layer file for each state and used a Definition Query to show only the counties for that state. Then I set the symbology using the restricted color ramp – the steps to doing that are below.
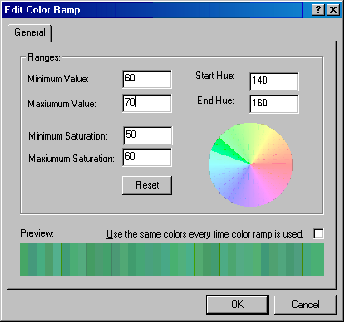
- Right click the layer in the Table of Content, click Properties and click the Symbology tab. Right click on the color ramp to see its Properties.
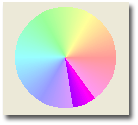
- Click and drag on the edges of the wedge on the color wheel to restrict the colors in the ramp. For example, you might set the wedge to the upper left in the green area. You can also set this by typing in the Start and End Hue values. Now set the value and saturation to something that will work for your map. You can view your setting on the Preview at the bottom. Click OK to accept all your changes.
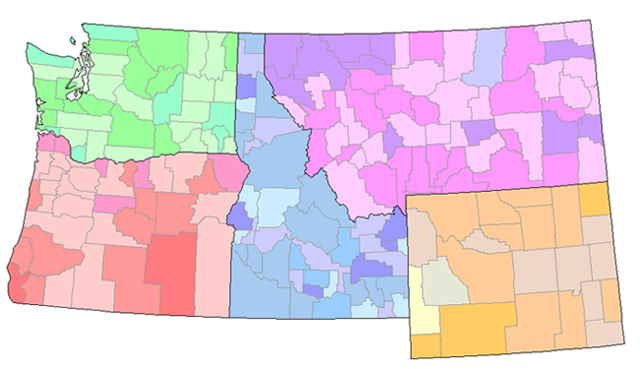
Because you will be doing this for each state, I suggest that you save the modified color ramps to your personal style. Here is how it looked when I did this for the Pacific Northwest:
For a map of the U.S. states, you will soon run out of unique hues (blue, green, red, etc.) that are distinguishable for each state, so you may also want to think about using the Four Color Map model that you can download from our ArcGIS Resources – Tools, Models & Scripts page. This model is used to make sure that no two polygons that share a border will be given the same color. This is done by assigning a number from one to four to each polygon. You would use this to assign the basic hues to each state, then you would use the restricted color ramp method I described above.


Article Discussion: