By Charlie Frye, Esri Chief Cartographer
One of the most frequently recurring topics on Mapping Center is what to do with stacks or clusters of point features on maps. In August 2007, I wrote a blog posting on how to use Maplex to display coincident points, and this worked for some scenarios, but not all.
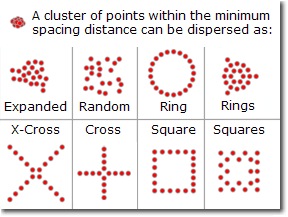
New with 9.3 is a tool called Disperse Markers; it’s in the Cartography toolbox, in the Symbolization Refinement toolset. The only caveat to using this tool is that your data need to be stored in a geodatabase because the tool works on representation symbology. This will be easier for many map makers, and it will work for more scenarios than the Maplex solution did.
Here is the basic procedure:
- Symbolize your point features.
- Convert the symbology to representations.
- Run the Disperse Markers tool with your point representation layer as the input.
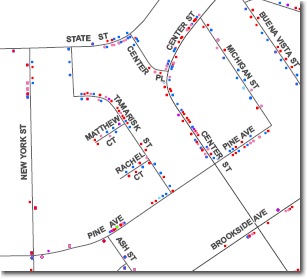
Here is an example of my results (using the same voter data I used in the Maplex example in which each voter is represented by a point whose color is based on political party affiliation):
 |
 |
| Before: The points are stacked on top of each other, and there is no way know how many voters live at the same location. | After: The points are dispersed and it is easy to see all the voters, even those in apartment buildings versus single family dwellings. |
Some things to note:
- Even though the dispersed marker symbols are representations, i.e., the original point feature coordinate were not changed, they can be given a feature weight for labeling — notice how the Pine Ave. and Ash St. labels got adjusted.
- I had about 35,000 points in my dataset; it took about one hour and forty-five minutes to process. I used the Expanded option.
- Some of the same caveats that applied to the Maplex method apply here — for instance, there is no way to restrict the direction of dispersal, so some points may have been dispersed across streets in my example.
- The advantage of this method over the Maplex method is that all the points are shown, whereas Maplex may have determined that a point was too far away (based on my settings, which were hard to fine tune) so it got processed it as an unplaced label and was not shown.


Article Discussion: