By Charlie Frye, Esri Chief Cartographer
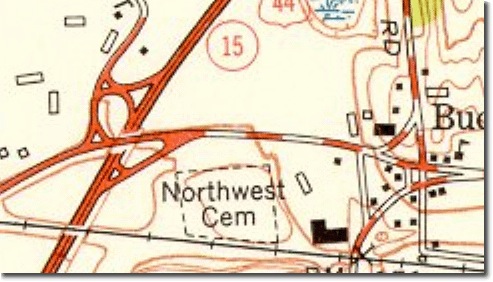
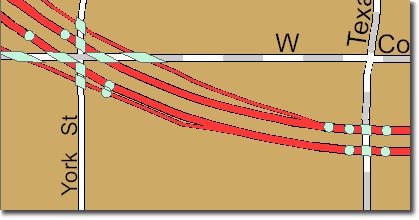
Symbolizing road overpasses or underpasses typically requires that you perform two data preparation steps. First, identify which roads overpass other roads. This may be very simple intersections between two roads, or it may include many other roads when dealing with complex highway interchanges. Second, represent the interchanges clearly. This task may mean simply changing feature or layer drawing order, or it can also mean knocking out or masking portions of underpassing features. The image to the left shows the underpassing highway being masked by an overpassing street and railroad.
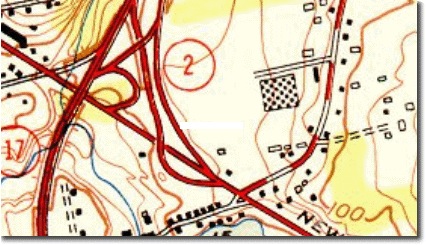
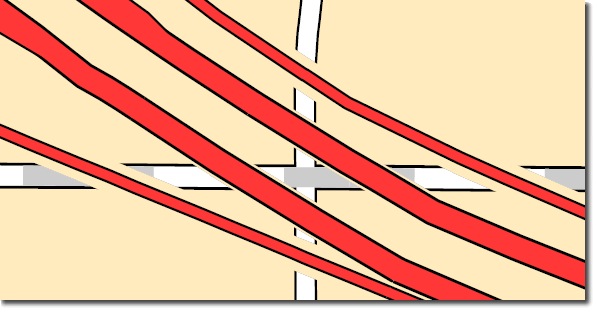
This second image, from an adjacent map sheet, shows the larger highway just being drawn above the major street. It also shows masking, but this time the mask is smaller, which makes the effect more subtle (and perhaps difficult to view on-screen).
Both of these techniques can be done with ArcGIS. First, we’ll discuss how to improve your data so you can use symbol level drawing to handle underpasses and overpasses. Then we’ll show how to use the same improvement to your data to create masks that will knock out a portion of the underpassing feature. The tasks involved in creating these effects will demand a fair amount of time and effort to master, and some of the tools needed for this procedure require an ArcInfo license. If you’re trying these techniques on your own data, we suggest that you focus on a relatively small area, such as an area that contains a freeway interchange and a few on/off ramps, as that will give you a feel for how this works without waiting for potentially lengthy geoprocessing tasks to run.
1. Prepare your data to show over- and underpasses:
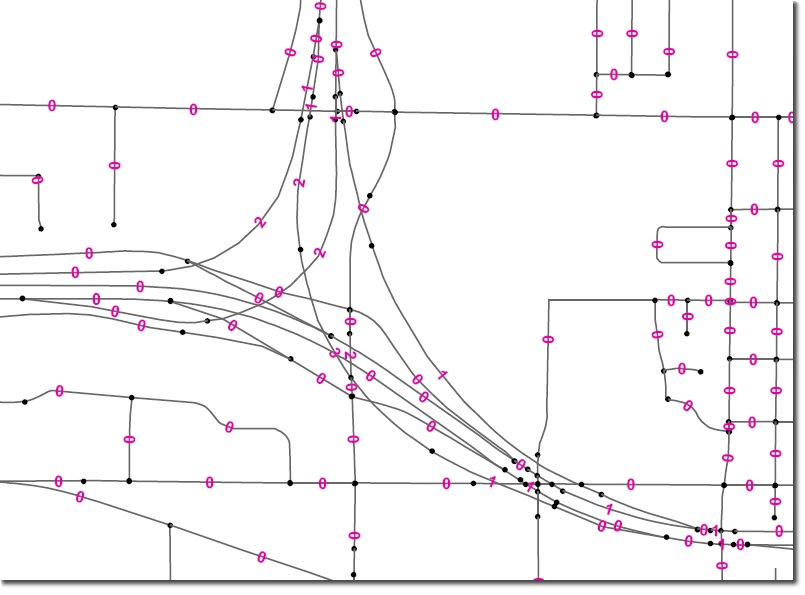
The key to managing over- and underpasses is that your road data should contain a short integer field (other data types will work, but this type is optimal, and supports feature class subtypes) that indicates the relative elevation level of the road features. (Note: this is covered in more detail on pages 316-319 of Designing Geodatabases.) The way this works is that the road level can be set to 0 for ground level features, which should be the default value. Overpass features then use a value of 1 and third-level features use 2 or higher to indicate the level. You will often need to split lines in order to create the appropriate relationships.
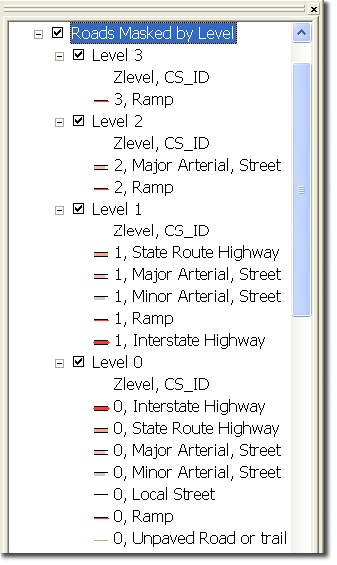
The image below shows an example where breaks in the line features are indicated by black dots and each segment is labeled with its road level. Notice that most segments are 0. It should also be noted that the process takes some time, both to learn and to complete. One tip is to validate your work by having two layers that each have the same data source, and symbolize these layers like each of the two images shown below. That way you can find problems based on the second image and quickly identify the cause using the first image.
2. Use Layer Properties to define symbol levels:
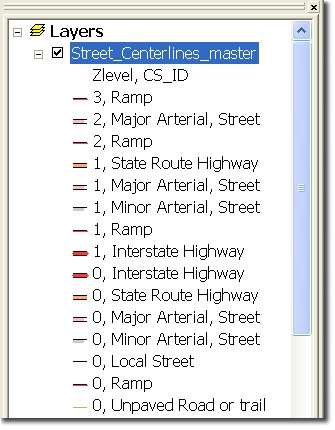
As a result of the preparation described above, when symbolized, the Z-Levels look like this:
The symbology (above) is based on using the Unique values, many fields option in the symbology tab of the Layer Properties dialog box. The first field is the Z-level and the second field (“CS_ID” below – this is a standard name we use for the field that contains our cartographic symbol ID) determines which symbol will be used. Shown below is how this symbology looks in the table of contents:
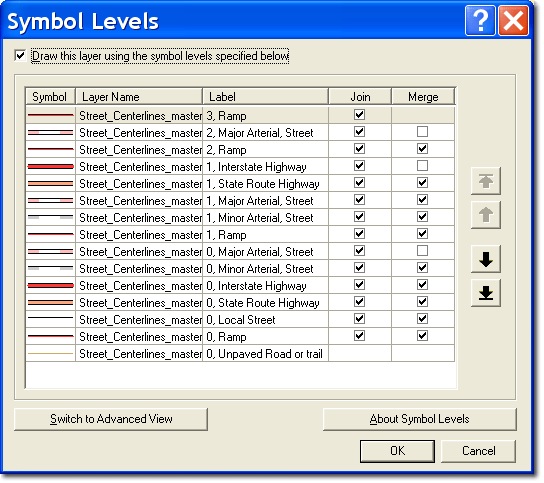
To get the symbol level drawing to work properly, use this next image as a guide:
However, when working with a map this complex, using the Advanced View is indispensable for working out more specific details. Here is what that looks like for this example:
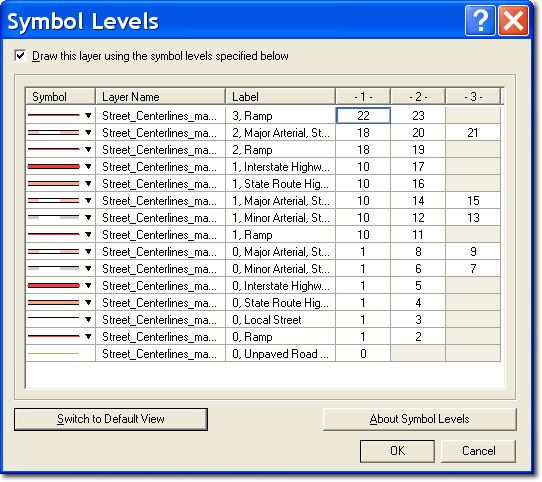
This view makes it possible to specify a drawing level for each layer in each symbol. In this example, the layers #1, #10, and #18 are the black casings. The same thing is represented, though less explicitly, in the default view by the uppermost symbol for a given Z-level value not being merged.
3. Create masking layers with geoprocessing tools.
In order to break underpassing roads, use the Intersecting Layers Masks tool (ArcInfo only). First, you’ll need to make a pair of layers in your map that contain definition queries that assign ZLevels to each layer. These layers will be used as the inputs for the tool. In this example we ran the tool three times to get all the masks we needed:
ZLevel1 over ZLevel0
ZLevel2 over ZlevelsUnder2
ZLevel3 over ZLevelsUnder3
There are a couple of key items to know about before running the Intersecting Layers Masks tool. First is that you know your map’s scale ahead of time and make that your reference scale. Second is to know the value for the margin parameter of this tool. The margin is not based on your symbol, but instead is based on the geometry (unlike the Feature Outline Masks tool which uses the symbolized geometry). So, make sure the margin is wider than at least 0.5 points more than half of your widest symbol’s width e.g., if your widest symbol is 3.0 points, the margin should be at least 2.0.
NOTE: one important procedural issue relating to part 1 of this series is that now when you use the Dissolve tool you will also need to include the Z-Level field.
TIP: To save a lot of processing time when using the Feature Outline Masks tool, use the Select by Location tool to select the underpassing streets that intersect the overpassing streets, that way, only the relevant underpassing streets will be considered.
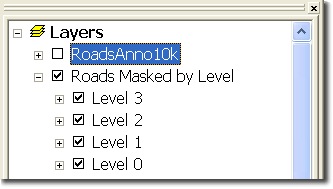 The images of the Symbol Levels dialog box shown in the section above were captured from a single layer’s symbols. In order to take advantage of the variable depth masking, a group layer is needed that contains a layer for each road level (an example is shown to the right). Each layer can be a copy of the single layer shown above, but set the definition query to include only the features from each specific Z-level. Instead of using the each layer’s symbol level drawing, you should use the symbol level drawing option at the group layer level. However, before you do that, remove any of the symbols from each of these layers that do not match that layer’s Z-level.
Now you can set up the variable depth masking that will knock out the underpassing roads. You will, however, need to remove some of the features that the Intersecting Layers Masks tool produces (delete them or use a definition query). The issue is that small circular masks are produced at the intersections of features with different Z-Levels. Fortunately, these are always the smallest features in the masks layer, so in this case these features were always of an area smaller than 180 sq. meters. The image below shows them as circles (versus the features that look like parallelograms).
Shown below is an excerpt of the final result, including what the Table of Contents looks like. The Symbol Level dialog box looks exactly the same because there are no more and no fewer symbols than before, when there was only one layer.
To wrap up, it is worth noting that it took us dozens of hours, a bit more than two weeks (over a much longer period of time) to upgrade the original dataset we received from the City of Redlands. The process helped us identify a number of things to avoid (that we won’t burden you with) and we ultimately boiled things down to the process given above.
Don’t forget the third installment on this topic is coming soon, which will cover how to prepare your data to use representations to depict cul-de-sacs and dead-end streets. We will also cover using representations for the dashed line symbols, which didn’t look too bad in the above examples (but you didn’t see the rest of the map!).


Article Discussion: