See Where People Spend the Most on Beer
Beer lovers from around the world are gathering in Munich, Germany to celebrate Oktoberfest. In 2014, close to six and a half million people attended the festival and consumed 6.9 million liters of beer–that’s a lot of lifted steins!
For those who can’t celebrate in Munich, there are plenty of opportunities to lift a stein in the US. Among the most popular festivals are Oktoberfest Zinzinnati in Cincinnati, Ohio that attracts more than 500,000 people, followed by the Denver Oktoberfest that attracts more than 350,000 people.
Thousands of German-Americans probably brought the traditions of Oktoberfest with them when they moved to the US. Germans have been immigrating in significant numbers to the U.S. since the 1680s, when they settled in New York and Pennsylvania. The US Census notes that Pennsylvania has the largest population of German-Americans; 3.5 million people claim German ancestry — more than in Berlin. Allegheny County, which includes Pittsburgh, has 348,979 German-Americans. Even though a large percentage of the Pennsylvania population is of German ancestry, beer preferences tend to vary by cities. For example, Pittsburgh residents drink regular and premium domestic beer more often than Philadelphia residents – probably because of the slightly higher median income in Pittsburgh; $38k compared to Philadelphia’s $35k. Philly residents buy beer in full-service restaurants four times more often than Pittsburgh residents; probably because Philly is a larger metro area with have more options to go out and 1.5 million people, compared to a little over 300,000 people in Pittsburgh. Philly residents spent $50,141,458 (total annual spending by all households) on beer away from home, compared to $12,823,149 spent by Pittsburgh folks.
Beer is big business everywhere in the US, not just in Pennsylvania. According to the Brewer’s Association of Boulder, Colorado, the overall beer market produced $101.5 billion in revenue in 2014. The growing craft beer market generated $19.6 billion.
Top Cities by Spending
The top three cities in terms of total yearly spending by all households on buying beer away from home are New York, Los Angeles, and Chicago. At $415,322,157, New Yorkers lead in buying beer away from home; Los Angeles residents came in second at $162,463,309, and followed by Chicagoans who spent $119,676,618. However, these high spending numbers could be because of the large number of people living in these three cities. If you compare cities by average yearly spending away from home per household, Bethesda in Maryland, Hoboken in New Jersey, and Palo Alto in California lead the way with average annual spending of $280, $267, and $255, respectively per household on beer away from home. Perhaps median incomes more than $150k, $120k, and $135k respectively in Bethesda, Hoboken, and Palo Alto, affect this spending.
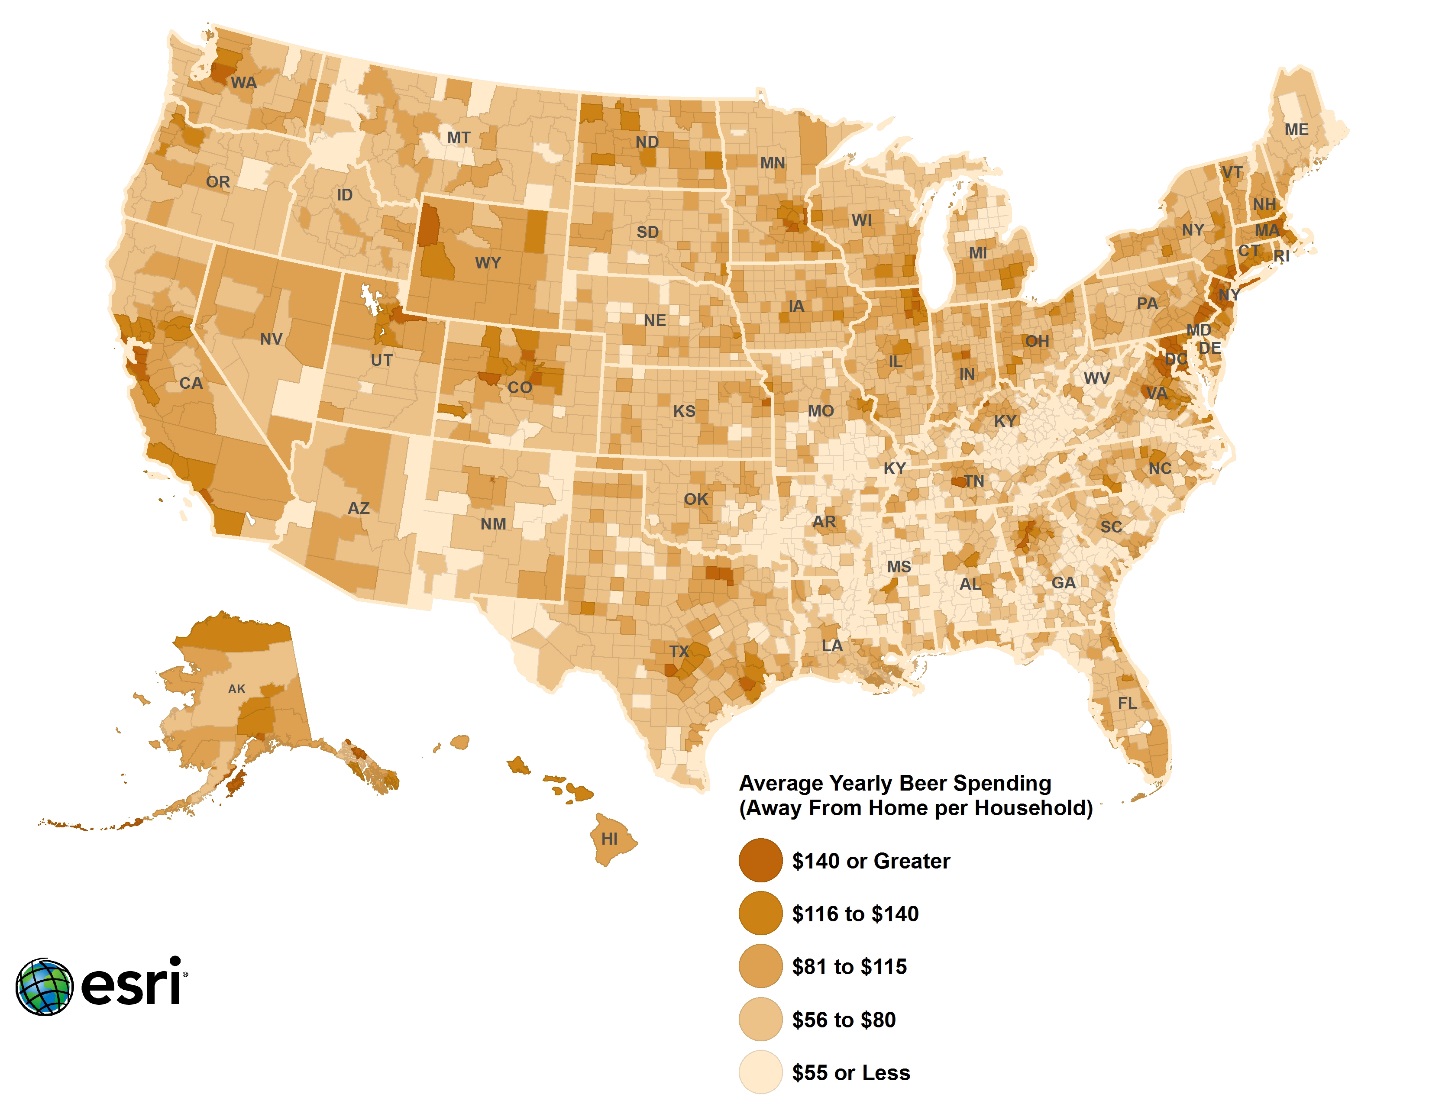
Although the total population numbers in Seattle, Denver, and Washington, DC are relatively comparable, beer preferences in each city are very different. For example, residents of Seattle spent $45,702,243 and Washington residents spent $50,685,289, nearly twice as much on beer away from home as Denver residents who spent $27,435,140. Folks in Seattle and Washington, DC drink more imported beer than Denver residents, who may be craft/micro-brewery fans.
Get Started
Where can you find this type of consumer spending and market demand information? Esri Demographics data can provide the answers. It includes spending, market potential, up-to-date demographics, business listings, and consumer segmentation data.

To explore Esri Demographics data and what people are spending on beer in your area, check out this interactive mapping app. With a few clicks, you can see consumer spending in your city or ZIP code and see how it stacks up to other neighborhoods in the US.