Anticipation and Anxiety for Students and Retailers
As summer vacations end, students eagerly or anxiously anticipate a new school year, new teachers, and new friends. Retailers also anticipate the Back to School (BTS) season, hoping that fickle consumers will buy their merchandise. The BTS category includes clothes, electronics, and school supplies for elementary, high school, and college ages.
When does BTS shopping begin? Traditionally, the BTS season began in late July and finished soon after school opened. This timeframe is longer now because some consumers prefer to replenish supplies throughout the year, or wait until the holidays to buy electronics and clothing.
Retailers view BTS, the second highest revenue season, as a predictor of consumer confidence and holiday spending. According to a survey conducted by the National Retail Federation, U.S. consumers are expected to spend about $68 billion on back-to-school and back-to-college items this year, down 9.3 percent from $75 billion spent last year. The NRF’s back-to-school spending forecast, which predicts per-family spending, will decline to $630.36, including electronics and apparel, down from $669.28 last year.
The NRF survey also states that perhaps a significant part of the reduction in spending might be because shoppers stocked up in 2014. For example, consumers that bought electronics in 2014 will probably spend less on that category this year, about $207.27 per person, down from $243.79. Families plan to spend an average of $97.74 on school supplies like notebooks, pencils, and backpacks, the second-highest amount since the recession.
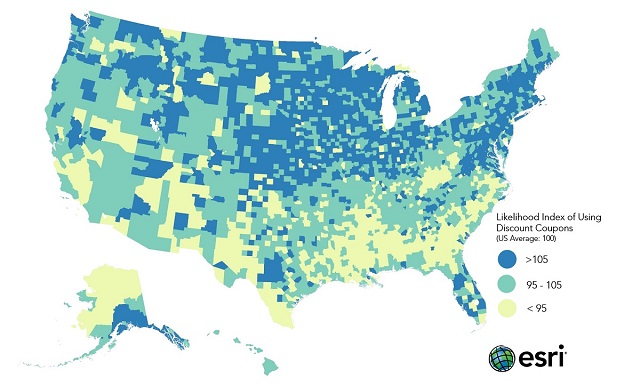
The Market Potential Index (MPI) in the Market Potential database compares area demand to national averages. The MPI value at the U.S. level is 100, representing overall demand. For example, residents of Morgan County, UT indexing at 121, are 21 percent more likely to use coupons than the average American. Residents of Lake County, TN, indexing at 60, are 40 percent less likely to use coupons than the average American.
Moody’s senior analyst Charles O’Shea told CNBC that low-income consumers, in particular, are still struggling. He attributed their “choppy” spending behavior to the fact that many are still feeling the pain from 2013’s payroll tax increase and the reduction in food stamp benefits that same year. “We’re still seeing a strained consumer at the low end,” O’Shea said.
“There’s a lot of pressure on parents and teachers for purchasing school supplies,” Bryant Harland, technology analyst at Mintel, tells Marketing Daily, about the desire to save money on back-to-school shopping. “For more than half of states, education budgets haven’t recovered from the recession [necessitating more out-of-pocket purchases].”
How can you learn more about consumers in your market? Data can help you answer this question.
Adding demographic data to learn about the different types of consumers in your area will enable you to better position your promotions to reach your targeted audiences. Tapestry Segmentation data provides detailed information about the lifestyles, activities, and preferences of residents in your market area as well as in every U.S. neighborhood.
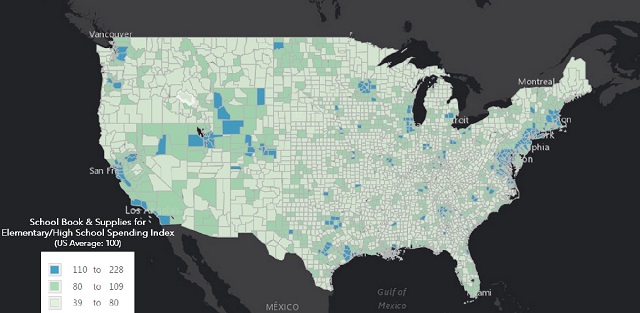
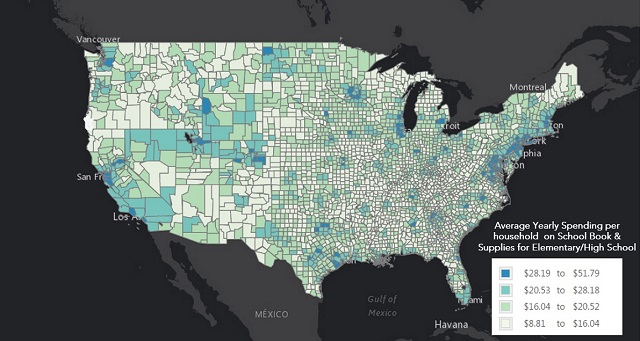
Esri’s Consumer Spending is reported by product or service and includes total expenditures, average spending per household, and a Spending Potential Index (SPI). The SPI compares average local expenditures for a product to the average amount spent nationally. The spending data says that Loudoun County residents spend an average of $51.80 per household for school supplies. The data also notes that La Paz County residents spend an average of $11.83 per household for school supplies.
How Can I Get Started?
When you use data to learn more about “who” the consumers and prospects are in your market, you can focus on the profitable areas, avoid those with less potential, target your marketing efforts, and grow your revenue. Check out Esri Demographics and sign up for a free ArcGIS Online trial to start using the demographic, consumer spending, market potential, and lifestyles data to help your business succeed.