Leverage Esri’s Market Potential data to help tap in to this multi-billion dollar industry.
Visiting a theme park as a vacation destination or a special day trip is on thousands of people’s bucket lists. The International Association of Amusement Parks and Attractions (IAAPA) counts more than 400 amusement parks and attractions in the US. The IAAPA noted in 2011 that 25% of Americans surveyed had visited an amusement park in the last 12 months, and that 43% of indicated that they planned to visit an amusement park in the next year.

Theme parks are a multi-billion dollar industry. For example, in 2014, Disney Parks and Resorts was by far the largest amusement and theme park company in terms of global revenue. With revenues exceeding $15 billion US dollars, Disney generated almost six times that of its closest competitor, Universal Studios Theme Parks (source: Statista).
Tap into the Theme Park Market Potential
As someone interested in business development in commercial real estate or retail, how can you tap into this big market? How do you make informed decisions about targeting people who might be interested in visiting a theme park and the kind of promotions they might respond to? How can businesses located near a theme park take advantage of the proximity and offer off-premise services such as hotel rooms, food, shopping, or movies?
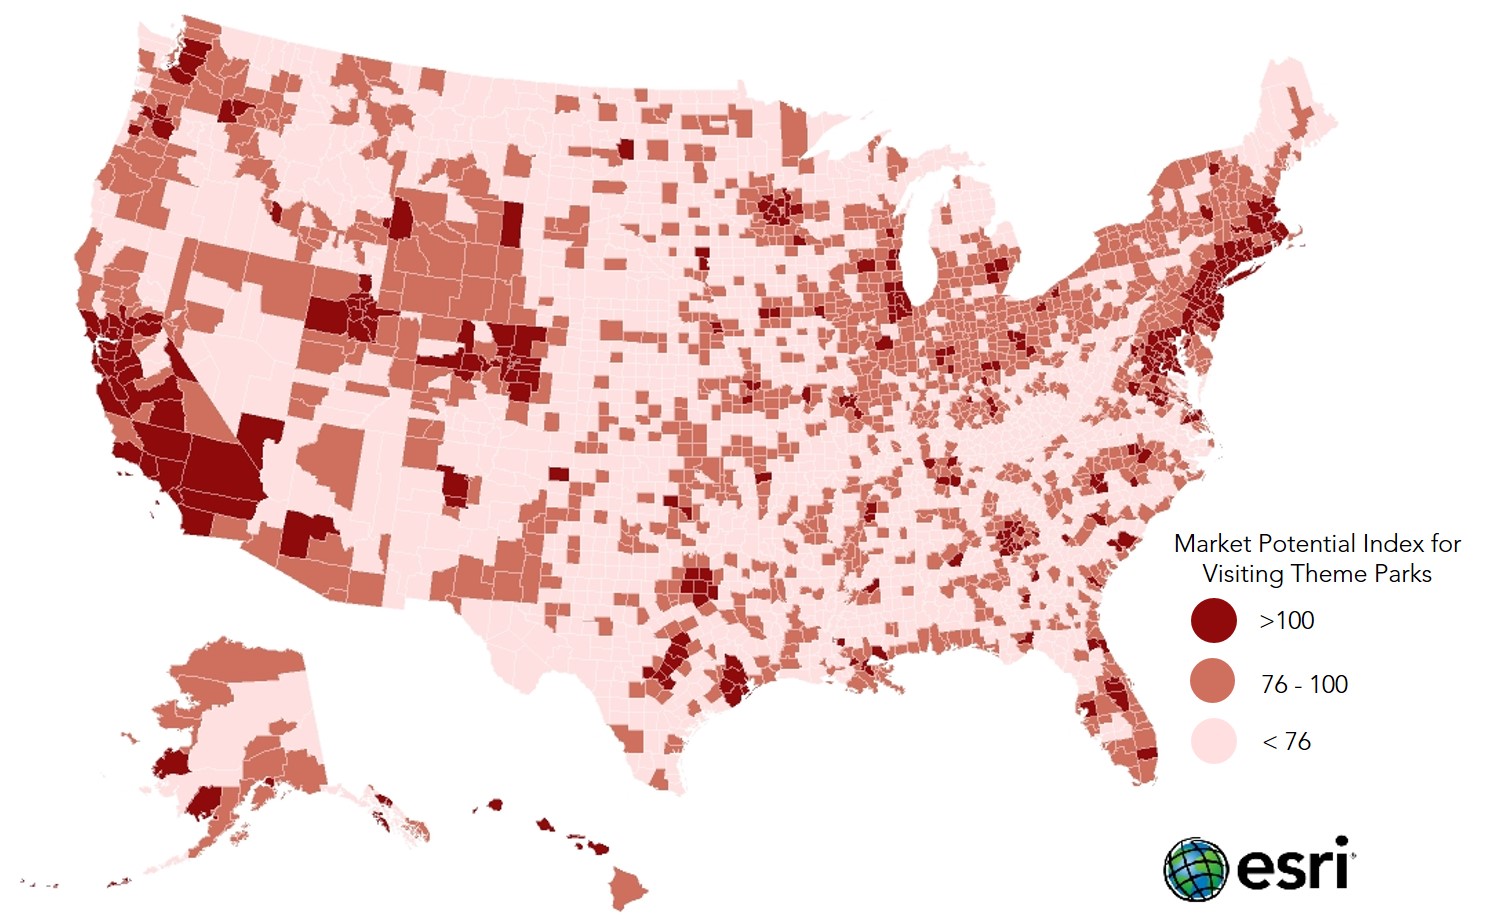
Esri’s Market Potential data can give you these insights. It provides you with a quick look at possible markets by measuring the demand for categories of products and services.
The Market Potential Index (MPI) compares area demand to national averages. The MPI value at the US level is 100, representing overall demand. For example, with the highest index of 121, Hawaiians are 21% more likely to visit a theme park than the average American. This could be because there are no major theme parks in Hawaii due to the high cost of land and construction, so Hawaiians must travel to the mainland to experience a major theme park. This is followed by New Jersey and California which have the MPI index of 119 and 118, respectively.

Knowing the market potential, the number of households, and the income in an area are good starting points. However, you need more information to understand the subtle differences in a market such as the lifestyles, interests, and activities of area residents. Esri’s Tapestry Segmentation data provides detailed information about every US neighborhood. Classified into 67 unique segments, Tapestry data is based on demographic and socioeconomic characteristics.
For example, top Tapestry segments for visiting theme parks include Boomburbs (affluent married couples with young children); Up & Coming Families (multilingual, multigenerational Hispanic families); American Dreamers (young, ethnically diverse married couples in multi-generational households); and International Marketplace (young, diverse, hard-working, mostly Hispanic families). If you are segmenting target consumers by county, you could look at Maricopa County, Arizona, with 72,579 Boomburbs residents and 158,038 Up & Coming Families residents. Harris County, Texas, counts 106,586 people in American Dreamers neighborhoods, and 314,630 people are found in International Marketplace neighborhoods in Los Angeles County, California.
How Do I Get Started?
When you use data to learn more about “who” your customers and prospects are, you can focus on the profitable areas in your market, save on your marketing budget, and increase your revenue. Check out Esri Demographics and sign up for a free ArcGIS Online trial to start using the demographic, consumer spending, market potential, and lifestyles variables and gain better success in your business.
insider