Analysis, 3D, Smart Mapping, and Other Trends Enable Us to Think About GIS Differently
The web continues to have an enormous impact on how we practice GIS and how we apply geospatial tools and capabilities to support our workflows and solve problems. It has fundamentally changed everything we do, and how we think. This trend has been evolving for years, but clearly has reached escape velocity and a new tipping point. No longer is the question “if” or “when” to embrace Web GIS, the question now is “how” to leverage the new opportunities and workflows it enables.
In an earlier post just after the 2015 Esri Federal GIS Conference, we covered the trending topics at that time. Here’s an update from the 2015 Esri User Conference, that focuses on how some of those trends have matured with new capabilities, and how a few new ones have arrived.
Portals
Thousands of portals—organization portals and Open Data portals—have been lifted worldwide, and it’s easy to understand why. A portal is an inherent part of the ArcGIS Platform, and an essential part of any GIS organization. Some portals are private, many are public. Some are on-premises, and others in the cloud. But what’s clear is that these portals are more than a home page or a website; they represent the hub, or the center, of an organization’s geographic information ecosystem, and they are clearly transforming how organizations work.
Content
If portals are the windows to Web GIS, content is its foundation—reliable, authoritative, ready-to-use content. What’s trending is the concept of an atlas, but not just any atlas, a living atlas. A dynamic collection of services curated by Esri, with contributions from Esri, data providers, and the global GIS community.
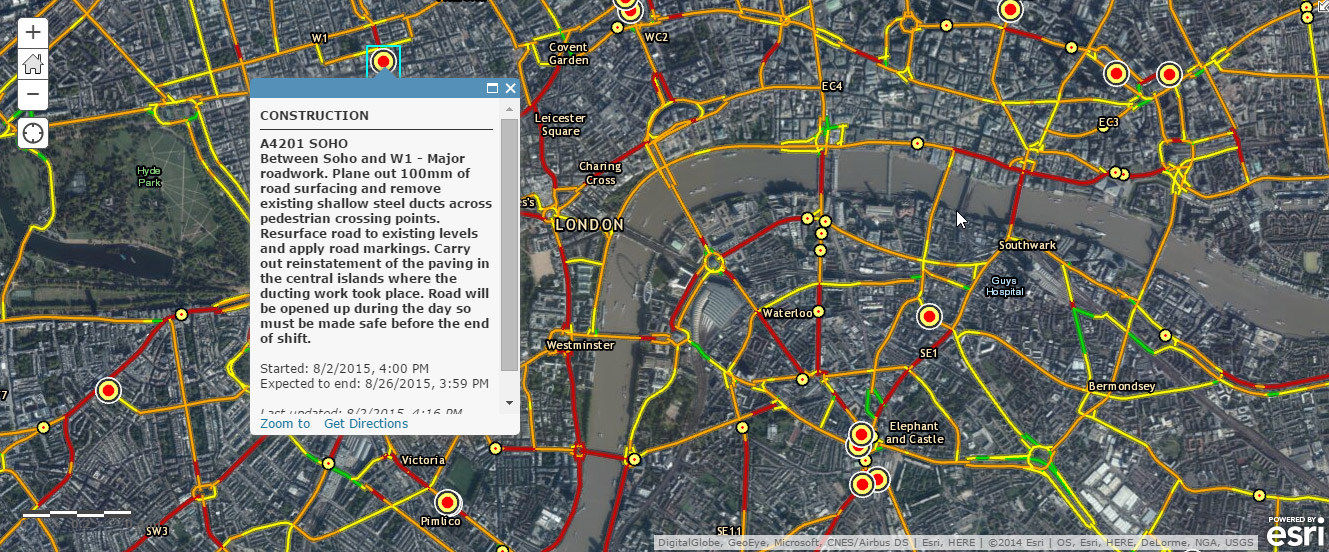
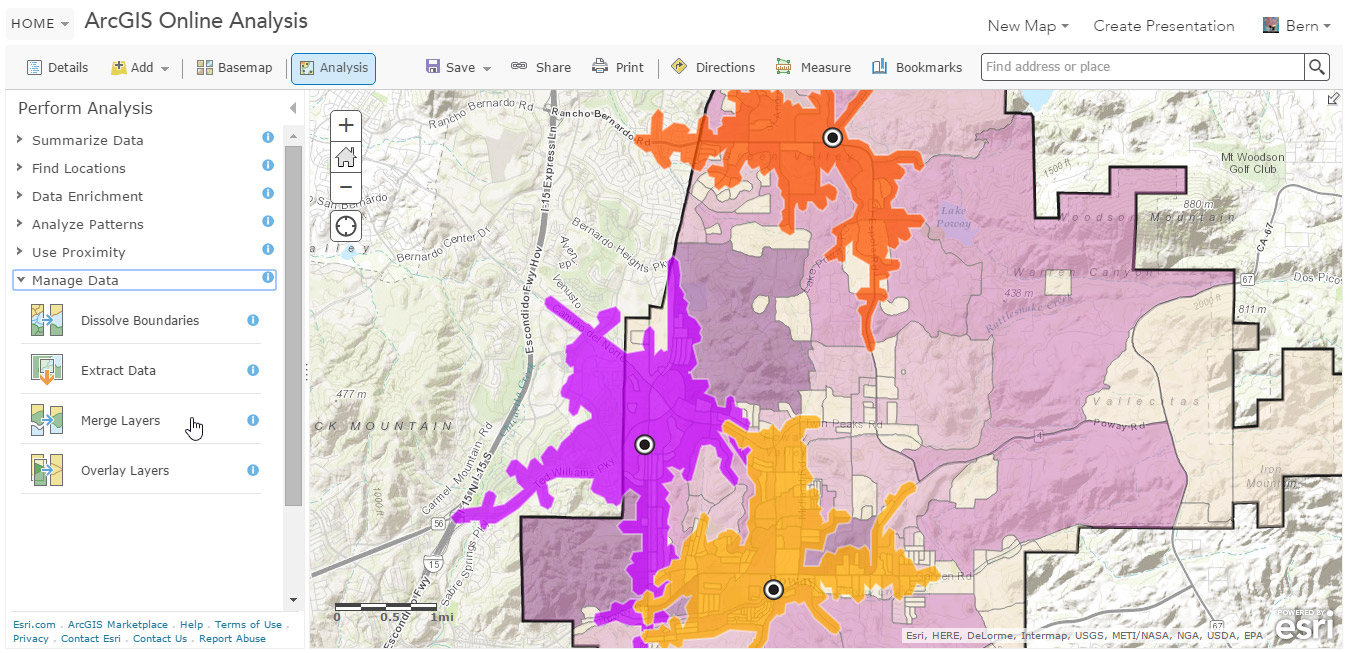
Analysis
Analysis is the heart and soul of true Web GIS. Hosted analysis and geoprocessing tools continue to grow in both number and capabilities. GIS professionals are familiar with these tools, and use them every day. But what’s trending here is that these tools can be used by anyone in an ArcGIS organization, and they are presented in ways that make them easy to understand and apply to common geospatial problems.
Web GIS has enabled 3D to grow across the entire ArcGIS platform. For example, ArcGIS Pro provide and integrated platform for 2D/3D visualization, analysis, and publishing. The 3D Analyst delivers advanced analysis supporting 3D workflows. Web scenes make it possible for anyone to view scenes in a browser. CityEngine offers advanced editing tools for urban designers. And ArcGIS Earth, to be released later this year, delivers 3D data exploration and support for KML-oriented workflows.

The 3D information model is also evolving to support cross-platform needs and better 3D information products. What’s trending here is availability and scalability, and new 3D server capabilities, plus hosted 3D content coming to the Living Atlas.
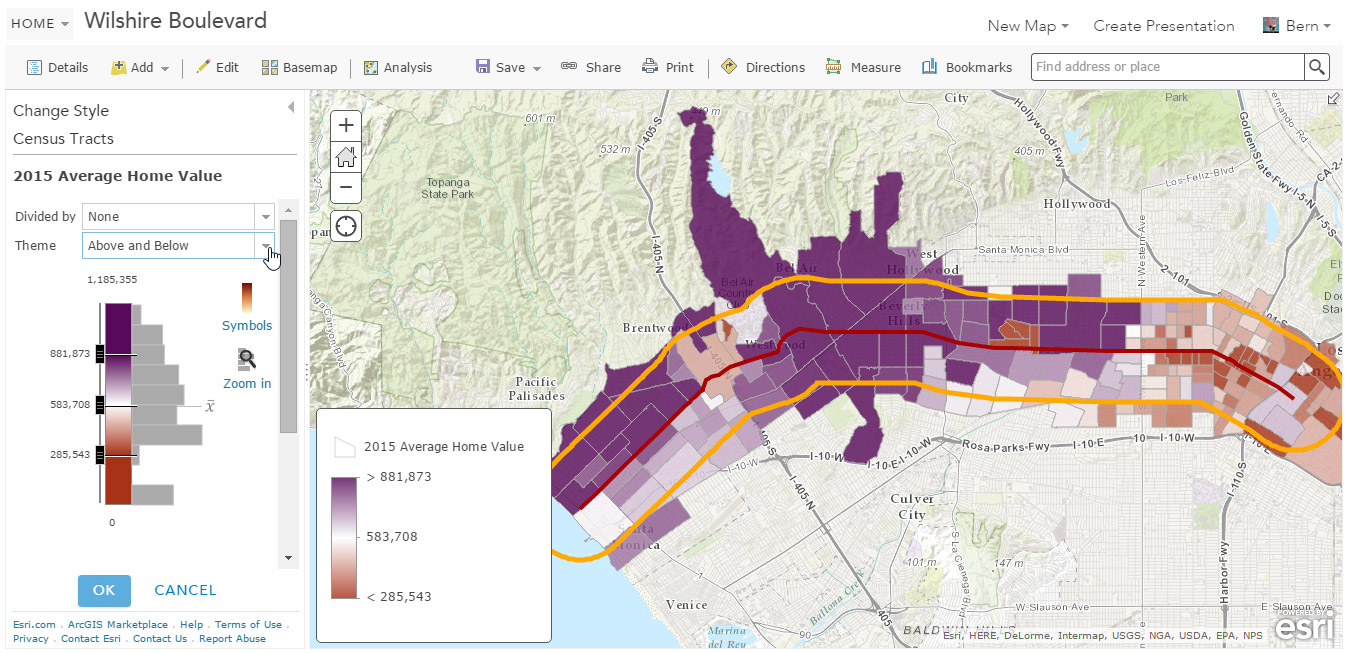
Smart Mapping
Smart mapping is new, unique, and also very powerful. So what is it? Simply put, it’s data-driven web cartography and exploration. Smart mapping presents the right tools at the right time when authoring, so you don’t need to be an expert cartographer to have a nice-looking map. Smart mapping tools also help you explore the data in different ways. So you gain more than just a map; you gain valuable insights that you can share with others.
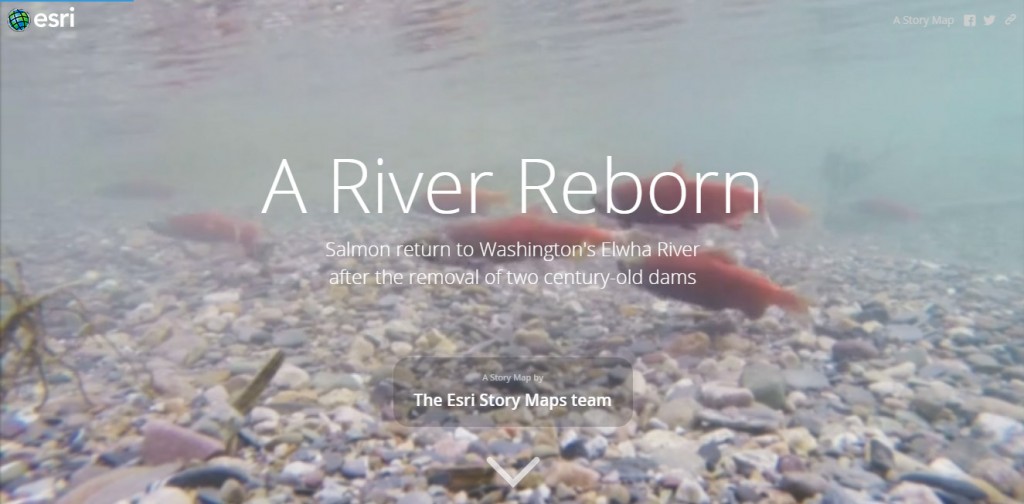
Already extremely popular, Story Maps continue to grow in use. Used by students, teachers, journalists, activists, and GIS professionals alike, they can entertain, inform, and inspire. Increasingly they are being used for “bread and butter” applications by GIS organizations, to serve internal communication needs as well as delivering information to a broader public audience. Without a doubt, Story Maps are fundamentally changing the way we communicate geographically.
Your Work is Becoming Pervasive
Web GIS has made GIS more pervasive—it’s amplified GIS. As a result, the tradecraft, knowledge, and skills of GIS professionals has never been more valuable.
Web GIS offers new workflows, and new ways to inform and empower a broader audience. This provides us all an opportunity to not just imagine the possibilities, but to think different, and re-imagine what’s possible.
insider