From traffic cameras to scientific sensors, story maps are a fast and simple platform for creating real-time dashboards that let the viewer see sensor data in geographic context.
New technologies are emerging and combining to enable the real-time collection and sharing of data. The result is a dynamic platform for real-time visualization, analysis, and understanding of our world.
Esri offers many options for the consumption of real-time data across the ArcGIS platform. A simple and effective—yet often overlooked — tool for the display of real-time data is Esri’s story maps technology.
Let’s take a quick look at four examples of real-time dashboards built with story maps.
Santa Clara Traffic Feeds
The most ubiquitous use of real-time data in story maps is the display of images from traffic cameras. This is a particularly nice example from the City of Santa Clara, California.
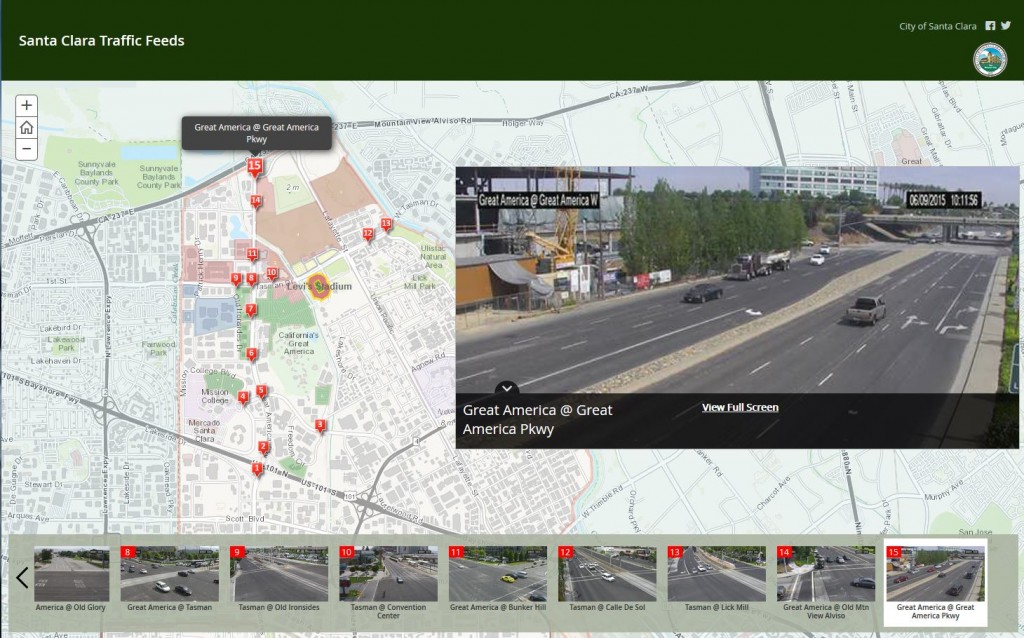
According to the city’s web site, “Traffic cameras provide an opportunity for drivers to make travel decisions based on road conditions. Knowing if there is congestion, an incident blocking the roadway, road closures, extreme weather or other condition can help you decide to forego travel or detour the area, making for an easier commute and safer roadways.” And seeing thumbnail images from multiple cameras displayed on a map gives drivers context and a deeper understanding of current traffic conditions throughout the entire city.
Global Forest Watch Fires
This story map from Global Forest Watch highlights the functionality behind GFW Fires, an online platform for monitoring and responding to fires in Southeast Asia. The application walks users through the GFW Fires application and explains its growing role in the fight against land and forest fires. Each section of the story map highlights a different feature of the platform, and tells the story behind how it is helping government agencies in Indonesia and other countries monitor and respond to fires.
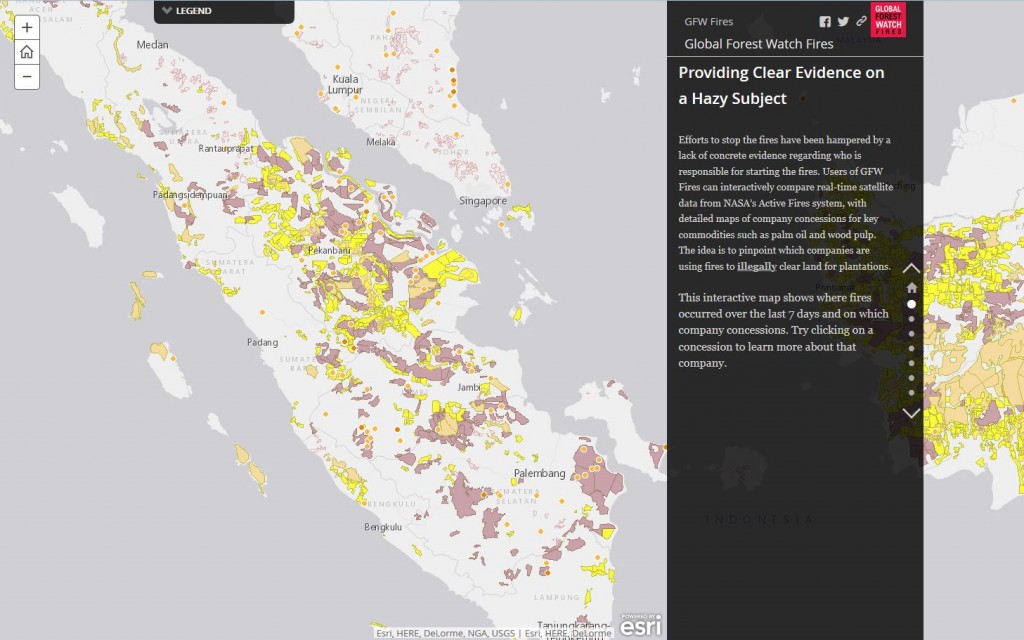
This story map was built using the Map Journal storytelling template and ArcGIS Online. More than just a dashboard, this story map shows the power of integrating real-time data streams into a larger map-centric story.
HJ Andrews Experimental Forest Dashboard
Located in the Willamette National Forest in Oregon, H.J. Andrews Experimental Forest supports research on forests, streams, and watersheds, and fosters strong collaboration among ecosystem science, education, natural resource management, and the humanities. Using the Story Map Tour storytelling template and ArcGIS Online, a simple map-based dashboard was developed to let researchers, administrators, and the general public view real-time data from 125 different sensors including webcams, stream gauges, and weather stations deployed throughout the forest.

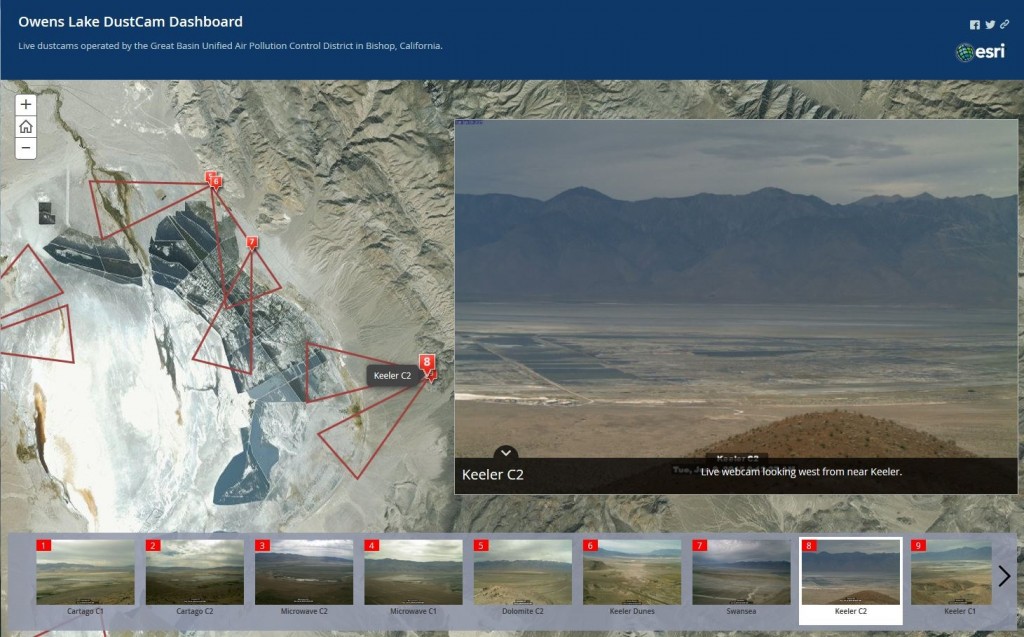
Owens Lake Dustcams Dashboard
Located on the eastern side of California’s Sierra Nevada Mountains, Owens Lake is mostly dry due to decades of water diversion and has become the largest single source of PM-10 particulate air pollution in the US. The Great Basin Unified Air Pollution Control District, a regional government agency that works to protect the people and the environment of Alpine, Mono, and Inyo Counties from the harmful effects of air pollution, maintains a total of nine “dustcams” to monitor conditions around the lake.
Use Story Maps to Build Your Own Dashboard
Does your organization have real-time data streams? Would you like to build a simple story map dashboard to help better visualize your data in geographic context? You can start by reading Bern Szukalski’s blog post, “Real Time” Story Map Map Tours.
insider