Empowering People with Spatial Analysis Tools
According to the MapAsheville website, “Priority Places is a free, interactive mapping tool provided by the City of Asheville to strengthen strategic economic development and planning activities. The mapping tool facilitates business siting, neighborhood renewal and real estate development by enabling the identification of optimal locations for activities.”
The website prompts users to select the criteria that matter most, weight each factor’s importance, and create a “priority map” based on the those choices as well as custom reports on a host of demographic data. It then uses weighted map overlay analysis to create heat maps of sites that best meet chosen criteria.
How does this work?
Weighted overlay analysis is a type of suitability analysis that helps you analyze site conditions based on multiple criteria. Weighted overlay analysis helps you combine, weight, and rank several different types of information and visualize it so you can evaluate multiple factors at once. By identifying and rating areas based on criteria, you can discover opportunities, risks, and constraints in an area.

Weighted overlay analysis produces suitability models. Suitability models help answer questions like “Where are the greatest risks for insect damage?” or “Where are optimal locations for a commercial development?” The answers to these types of questions depend on your input data and the criteria you define from that data.
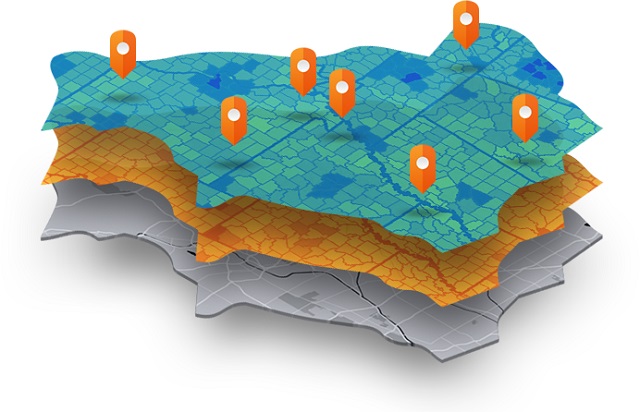
Weighted overlay has three conceptual steps.

- First, each raster layer is assigned a weight, as a percentage, in the analysis. This allows you to emphasize the relative importance of each layer in the analysis.
- Second, values within each raster layer are mapped to a common suitability scale. This allows you to compare the different types of information in each raster layer.
- Third, all raster layers in the analysis are overlaid. Each raster cell’s suitability value is multiplied by its layer weight and totaled with the values of other raster cells it overlays.
The result is a suitability value that is used for symbology in the output raster layer (OutRas).
The process of weighted overlay analysis can be greatly simplified for easy use by people without GIS experience, as seen in the Priority Mapping tool. You simply choose from a list of factors that are important to your decision-making, rank each factor by moving the slider bar to the left or right, and then have the application generate the heat map, which shows you the areas that best meet your criteria.

Weighted overlay analysis allows you to create “what if” scenarios by changing the importance (rank) of certain factors. Each map then becomes a snapshot of a specific scenario. Urban planners use this technique to show alternatives to the public and decision-makers. This method is equally effective for community members trying to understand impacts to their neighborhoods or other areas of interest or for identifying the best areas for activities.
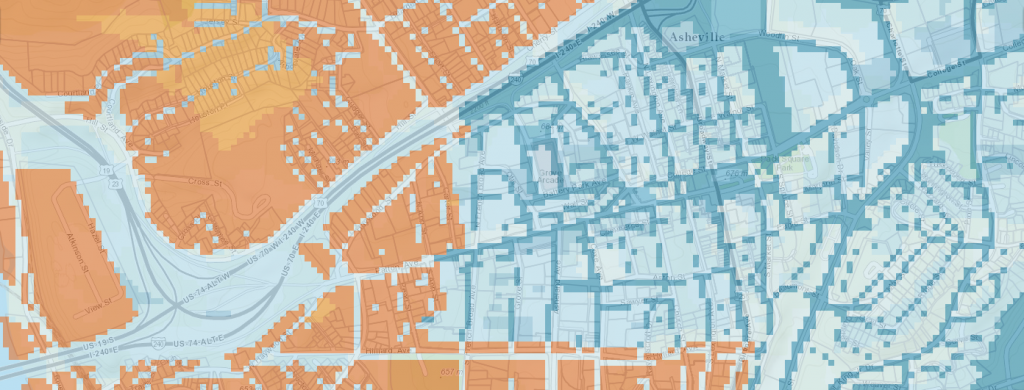
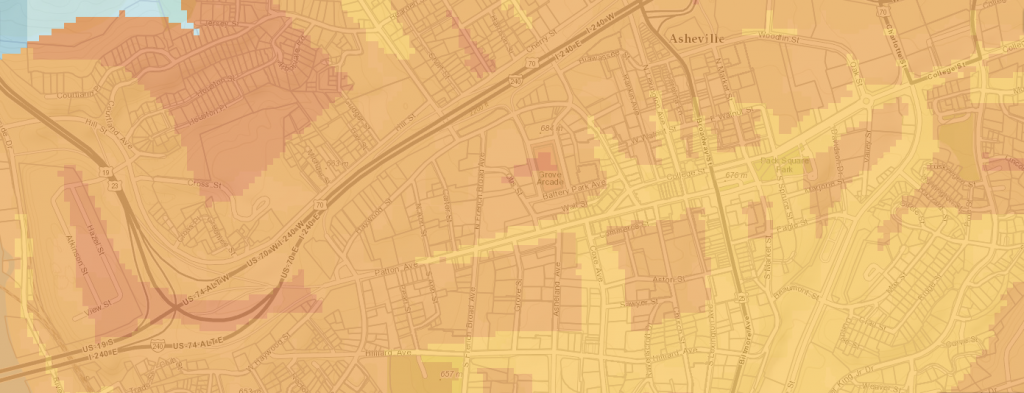
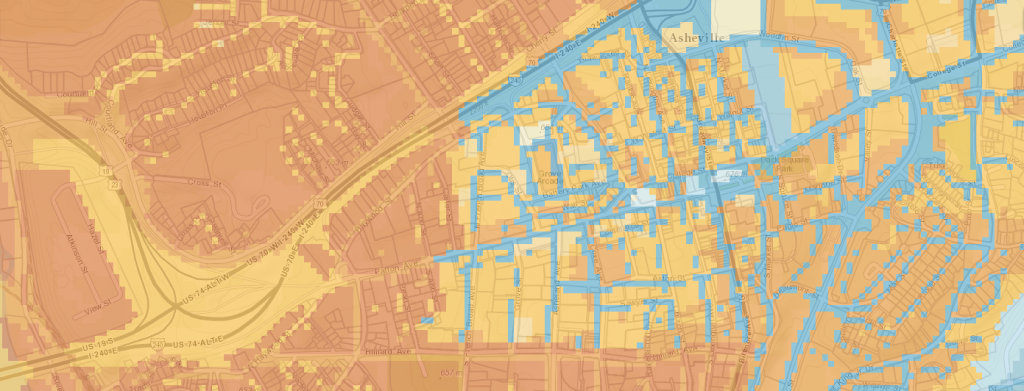
For example, varying the rank value of the same factors in Asheville’s Priority Places application results in multiple scenarios:
Tools such as Asheville’s Priority Places put the power of spatial analysis in the hands of the community, improving the quality and focus of the dialog between all stakeholders.
—–
Note: The story about the City of Asheville’s Priority Places tool is an excerpt from Geodesign: Case Studies in Regional and Urban Planning by Shannon McElvaney.