Turning big data into knowledge is all about relevance and context
Big data may be all the rage these days, but it isn’t exactly new. In fact, Esri has been dealing with big data since the inception of digital mapping more than three decades ago. When every contour, stream, street, rail line, park, building, or shoreline for the entire world is stored in an intelligent database, data doesn’t get much bigger than that.
Data as Big, Beautiful, and Living as the Earth
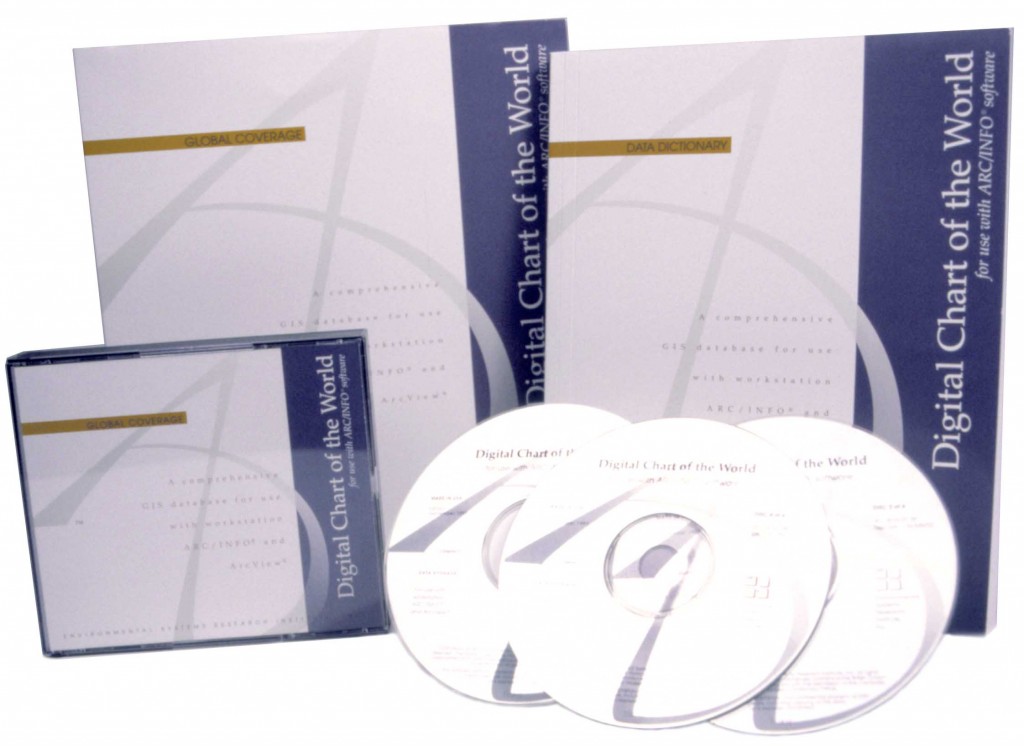
Back in 1992, Esri embarked on an ambitious campaign to create the very first seamless digital map and database of the whole world. This project—aptly named the Digital Chart of the World—converted paper maps of political boundaries, transportation lines, utilities, cultural landmarks, and more into a digital map product that could be viewed for the first time as something other than a pretty picture. In a world where CDs were still considered new and expensive storage media, and hard drives came in hundreds of megabytes, the 1.7 gigabyte database was not only huge, but it also challenged many computer specification and storage architectures. The Digital Chart of the World was created in 1992 and includes 2,094 map tiles representing the entire globe.
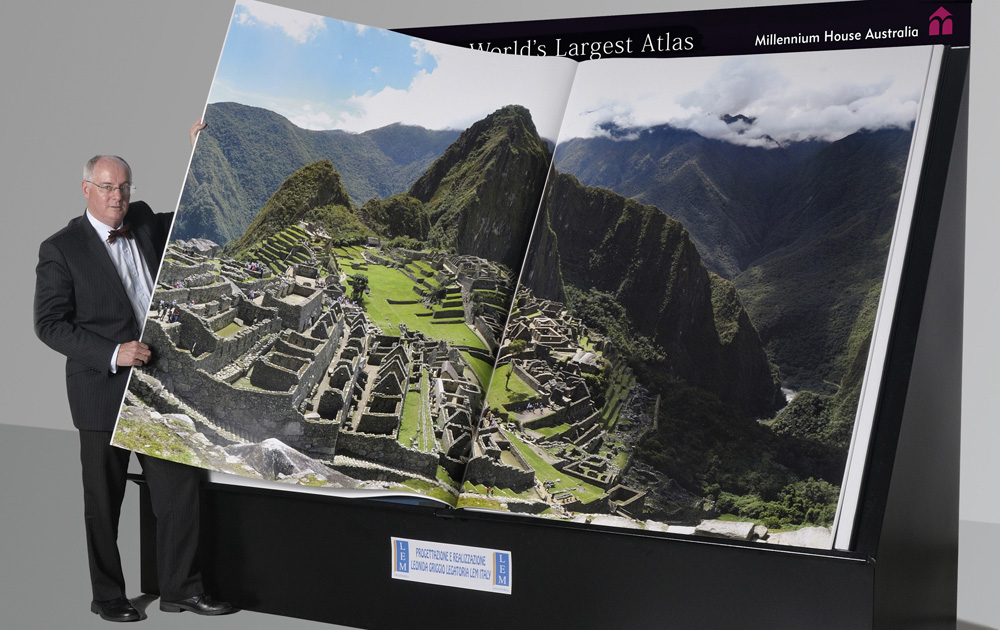
Fast forward to 2010, and Esri technology was once again to organize and produce another tome of topographic wonder—Earth: Platinum Edition, published by Millennium House, measuring six feet tall by four-and-a-half feet wide and weighing in at a staggering 264 pounds—by far the world’s largest atlas. A team of cartographers around the world worked together to create the book, a process that took two years from data collection to final production. Big book. Bigger data. Earth: Platinum Edition, by Millennium House.
Now, let’s come to the present and look at the Landsat program, a series of earth-observing satellite missions jointly managed by the National Aeronautics and Space Administration (NASA) and the United States Geological Survey (USGS). The first Landsat satellite launched in 1972, and the latest satellite in the series, Landsat 8, provides continuity, as well as improvements, on important global monitoring of our earth. Every day, USGS staff receive and process approximately 450 new Landsat 8 scenes, and these scenes are available for download at no cost within 24 hours of acquisition. The current archive of Landsat scenes now contains more than four million scenes.
Now that is big data.
Keep it Relevant, Keep it in Context
Esri makes sense of this massive amount of data—more than eight terabytes, and growing every day—to ArcGIS Online users via a collection of scenes. Esri downloads the latest Landsat 8 scenes daily and adds them to a set of image services that contain the best and most recent 50,000 Landsat 8 scenes, which requires about 60 terabytes for storage. Landsat 8, launched in 2013, includes two sensors that that orbit the earth, returning to the same location every 16 days.
How do you manage such a massive amount of data? First, not all scenes are kept in ArcGIS Online; otherwise the data volumes for storage would continually increase. Only the best and most current scenes are kept.
This points out what I think are a couple of fallacies and misconceptions about big data. First is the idea that big data needs to include everything. Keeping all of those videos, tweets, and page views ignores the importance of relevance and context. We really only need to identify relevant data and then apply it contextually.
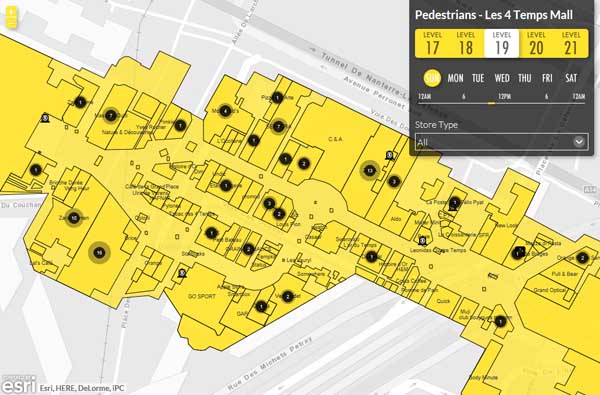
Second, the assumption is that because we have data we have information. Worse still is the implication that somehow simply having information leads to knowledge. In fact, we’ve been a little too slow to think about how to apply and use data to turn it into explicit knowledge. Unstructured data can be a bear to try and understand. Viewing and filtering by location makes it manageable, understandable, and actionable.
When data can be discovered and applied in context it becomes valuable. Vast data can become small—and therefore relevant and manageable—when it is applied in context across content layers and themes. And coming back to where we started: geography is one of the most natural, logical, and intuitive ways to discover, slice, sort, and ultimately apply big data to solve problems.
Keep it Simple, Keep it Small
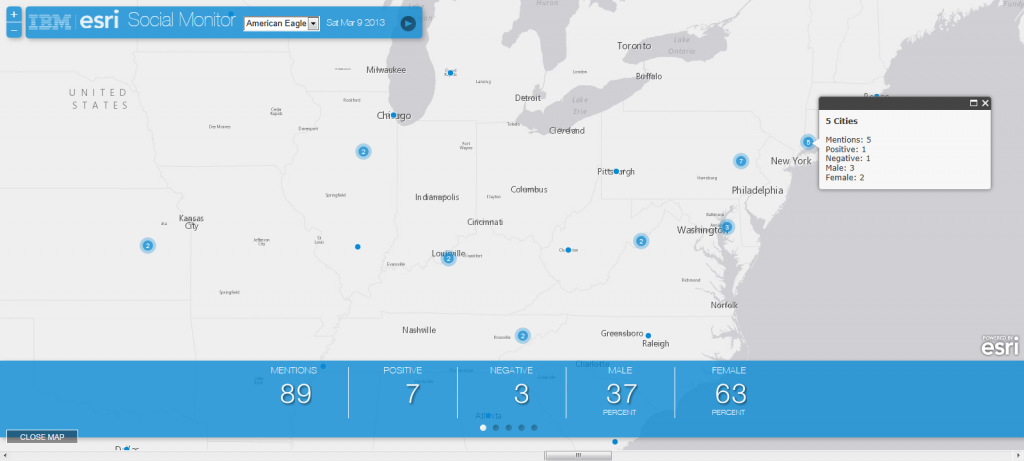
Esri has done a lot of innovation around this idea of keeping big data simple and small. We provide tools and APIs to aggregate and accumulate social media, documents, and other unstructured data into collections that are attached to places. These can be easily overlayed together to discover with statistics, demographics, and a host of other data. And this is all available in ArcGIS Online. Remember those Landsat 8 services? Those are here too. Basemaps for displaying and analyzing all sorts of information are available from Esri’s partners through ArcGIS Online.
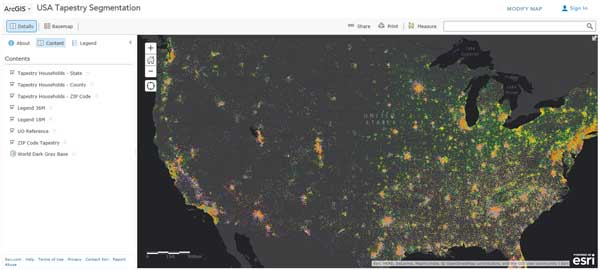
ArcGIS Online helps you sort data, apply filters, and explore and ask questions. You can take massive amounts of potential data and convert it into a smaller subset as needed. If that first data combination doesn’t work, you can easily try some other combination. ArcGIS Online provides access to more than 7,000 data variables for hundreds of thousands of places, making possible billions of combinations of searches and trillions of user defined ways to ask about that data—ring, drive distance, drive time, geographies, and more. You can appended this information to your Excel spreadsheets, or output it as a summary file/report. Esri location analytics solutions such as Business Analyst and Esri Maps for Office do the same thing, but in a familiar business IT setting. Making sense of every customer and potential customer in the United States? That a lot of data, but we’ve got you covered through the Esri Tapestry Segmentation System.
No matter who you are and what your business, Esri’s technology lets you tap into the big data fire hose and drink from it more manageably with a straw. Your limit? Only your imagination.