Esri is compiling a human geography database of demographics and statistics about all countries in the world and mapping this data using an innovative methodology.
Sociodemographic data is a valuable asset for businesses, governments, and society. Describing and understanding the human geography of the world requires tools to assimilate data in a statistically valid way that will allow for meaningful decision making.
Traditionally, people are counted in a census. But a census is time-consuming, costly, and does not collect the types of statistics at the level required to address today’s complex societal issues.
Advances in technology are changing the type, quantity, quality, and timeliness of information available. The ideal human geography database would include uniform social and demographic information about all human populations on the globe. It would include population, household, housing unit, business. and economic information that would allow determination of societal characteristics at any scale from macro to micro.
Esri’s new database takes advantage of this new information to track and estimate populations to support better decision making by modeling a dasymetric surface. [Dasymetric is a technique in which attribute data that is organized by a large or arbitrary area unit is more accurately distributed within that unit by the overlay of geographic boundaries that exclude, restrict, or confine the attribute in question.]
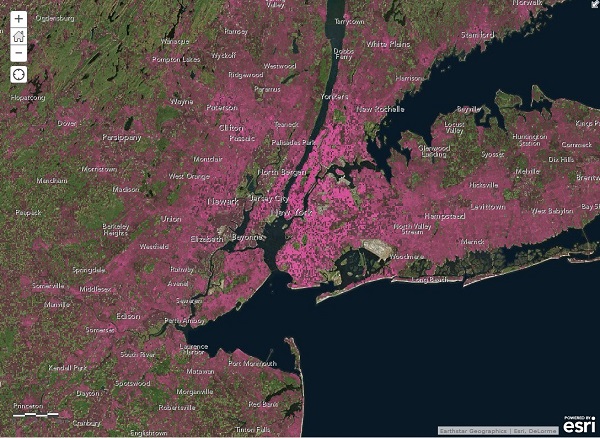
This surface will allow comparative studies and accurate depiction of statistics to ad hoc areas. The population surface is modeled from imagery, road networks, and populated place locations to create an urbanization likelihood score. This score is normalized against statistical polygons and used to apportion the statistics to a more detailed geographic depiction. The point surface is modeled from 15-meter resolution imagery, detailed road intersections, and populated place locations. It is then instantiated at a nominal resolution of 250 meters.
The ArcGIS Online geoenrichment API can use the completed database to enrich points and polygons anywhere in the world. The global model is currently complete and approximately 130 countries are currently being served as part of the ArcGIS Online services. For these countries, a detailed report can be requested that will show the demographics for any arbitrary geography such as a watershed, drive-time area, or an area affected by a disaster.
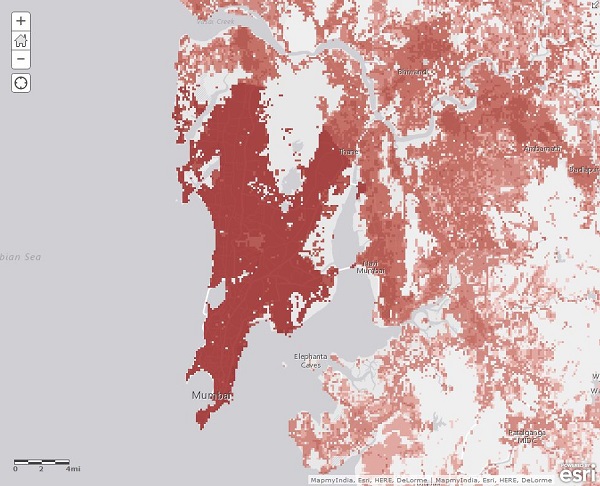
Additionally, the likelihood surface has been used to create a global population map by obtaining the latest census population data for the remaining areas of the world. These areas were compiled at first order administrative areas equivalent to states in the US. Population figures were normalized to the United Nations 2013 country estimates.
For countries that are part of the geoenrichment dataset, the most detailed level of geography available was used to apportion the data to the grid. This entire global census geography dataset consists of approximately 1.6 million polygons, and the likelihood surface was then used to assign population to every landmass grid cell in the world. This detailed 2013 population map is a unique depiction of the population distribution that will be available on ArcGIS Online and can be used with ArcGIS Online accounts.
[ Update: you can access the map here http://www.arcgis.com/home/item.html?id=ac0401d78fa24a10a9151ffe50f35afe]
insider