Geography—the scientific foundation of GIS—has for many years been concerned with exploring and describing our world. Historically, explorers lead grand expeditions to the farthest reaches of the globe. This golden age of exploration contributed greatly to our understanding of how our world works.
This was followed by the space age—an era where we left the planet and turned our cameras and sensors to look back on our home, giving us an entirely new perspective. Bound to the surface of earth for millennia, humankind was getting its first opportunity to look at our planetary system as a whole—from a few hundred miles up in space.
[iframe width=”100%” height=”480″ src=”http://www.arcgis.com/home/webmap/embedViewer.html?webmap=048279c22b154e0199a45783aafa7bd0&zoom=true&scale=true” marginwidth=”0″ marginheight=”0″ width=”500″ frameborder=”0″ height=”350″ scrolling=”no””]
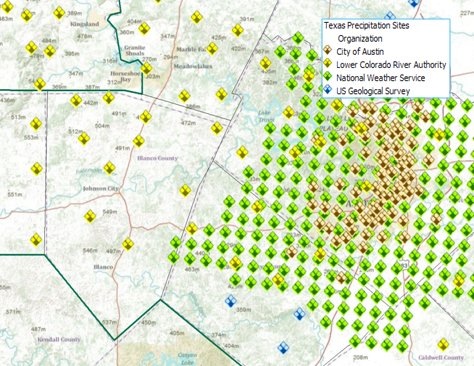
Live Stream Data Displayed via USGS real time KML file
Exploration 2.0
While data remotely sensed from satellites continues to play an important role in monitoring and understanding our planet, “earth observation” has more recently taken on a whole new dimension thanks to deployment of an increasingly complex and pervasive network of earthbound sensors. These sensors are practically everywhere you look—and in places you could never imagine. From stream gauges to seismographs, from weather stations to air quality monitors, from ocean buoys to even our cell phones, countless sensors are measuring and collecting important data about our planet at a rate that seemed impossible just a short time ago.

A Global Dashboard
Modern science and advanced technology have resulted in unprecedented access to global environmental information through the placement of countless sensors across the planet—and the linking together of this information through the Internet. The sensor web has inundated us with data that needs to be stored, managed, analyzed, and used to inform better decisions about our many social and environmental challenges. Integrating and synthesizing all of this disparate sensor data into a single, comprehensive view—a global dashboard—is our next great opportunity for exploring our world.
The New Explorers
We live in a world full of sensors. Thanks to the rich information flow they provide, and the availability of new mapping tools to display and analyze this information in context, now everyone can be an explorer. This has far-reaching benefits to both society and the environment, ushering in a new era of understanding and leading us towards more informed, equitable, and sustainable action.
insider