Most Recent in ArcGIS Blog
What's new in ArcGIS Bathymetry for ArcGIS Pro at 3.3
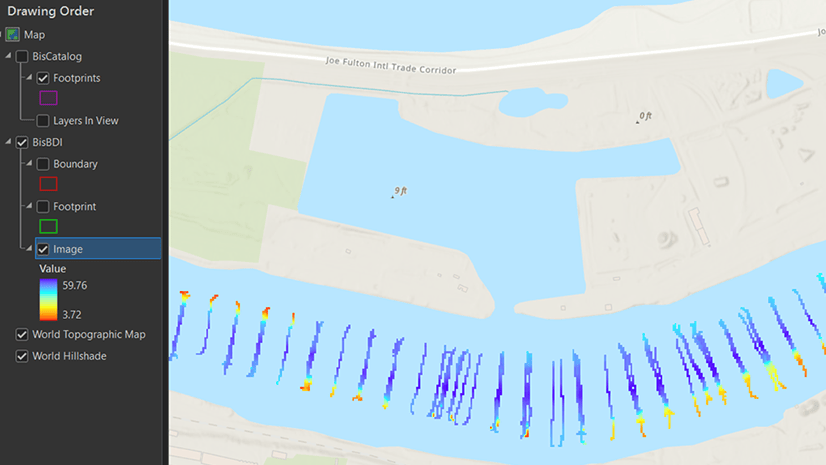
ArcGIS Bathymetry introduces three new tools and enhances Compose Surface capabilities in ArcGIS Pro 3.3
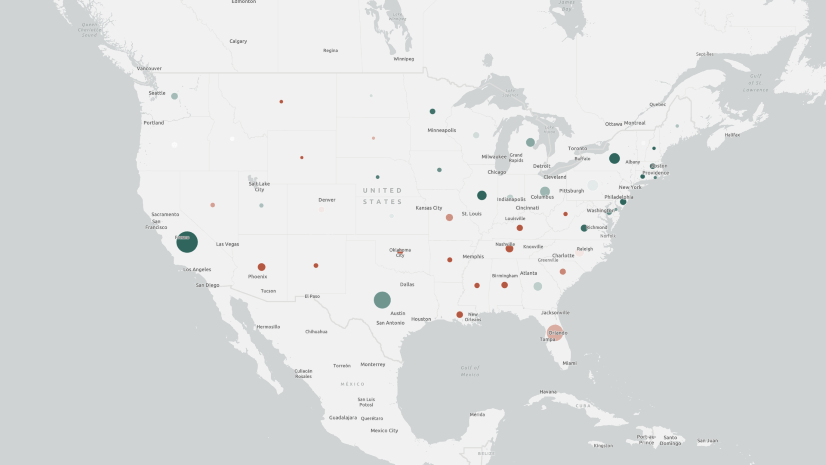
Identify the best location for an urgent care center
Multiple Authors | Analytics | April 2, 2024
Use suitability analysis in ArcGIS Business Analyst Web App to locate a site for a new urgent care center in Maverick County, Texas.
Most Recent in ArcGIS Blog
Krista Carlson | ArcGIS Pro | May 07, 2024
ArcGIS Bathymetry introduces three new tools and enhances Compose Surface capabilities in ArcGIS Pro 3.3

Multiple Authors | ArcGIS Utility Network | May 7, 2024
Learn about the new capability of the utility network to use the digitized direction to perform analysis of stormwater and wastewater networks!
Multiple Authors | ArcGIS Pro | May 7, 2024
Model realistic water flow, share your GIS story, add hyperlinks to your text elements, and so much more with the ArcGIS Pro 3.3 release.

Multiple Authors | ArcGIS Hub | May 7, 2024
Laura Sharp, PhD, shares how to capture residents’ perspectives and unique needs into the City of Tucson's decision-making processes.

William Hackney | ArcGIS StoryMaps | May 7, 2024
Learn about the options available for configuring your web maps and scenes in ArcGIS StoryMaps to make them effective and impactful.

Dejan Parac | ArcGIS IPS | May 7, 2024
Learn what's new in the ArcGIS IPS May 2024 release, explore native GIS support, IPS aware maps and ArcGIS IPS Setup app enhancements.
Multiple Authors | ArcGIS Hub | May 7, 2024
Building local resilience against community challenges means collaborating with your community early.
Multiple Authors | ArcGIS Utility Network | May 6, 2024
2024 Network management release plan for Utilities and Telecom industries

Thomas Coughlin | ArcGIS Experience Builder | May 6, 2024
Group filters are new with the February 2024 update. Available now.

Jon DeRose | ArcGIS Utility Network | May 6, 2024
Learn more about exciting new functionality and improvements made with the recent Network Management Release of the ArcGIS Utility Network

Multiple Authors | ArcGIS Enterprise | May 6, 2024
Discussion with Xander Bakker, Esri Colombia, on his unconventional path to GIS and how he truly loves his work.

Robert Krisher | ArcGIS Utility Network | May 5, 2024
Learn how to model flow and perform analysis with wastewater networks using the ArcGIS Utility Network

Caitlyn North | ArcGIS QuickCapture | May 3, 2024
The answers to questions from the March 2024 ArcGIS QuickCapture Introduction and What's New Webinar.

Multiple Authors | ArcGIS Video Server | May 2, 2024
The 11.3 release of ArcGIS Video Server has various improvements that expand how customers can interact with video in ArcGIS.

Sophia Giebeler | ArcGIS Pro | May 1, 2024
The release of ArcGIS Pro 3.3 for ArcGIS Aviation Airports and ArcGIS Aviation Charting includes new and enhanced tools.
William Hackney | ArcGIS StoryMaps | April 30, 2024
Learn about USDOT's transportation equity initiatives through an interview with Geospatial Information Officer Amy Nelson.

Multiple Authors | ArcGIS Community Analyst | April 30, 2024
ArcGIS Community Analyst is being deprecated entirely, with its final release schedule for October 2024. Read the blog for more information!
Multiple Authors | ArcGIS Hub | April 30, 2024
Sustained collaboration between government and community groups makes big goals attainable.

Stephanie Oliver | ArcGIS Online | April 30, 2024
The Arcade pop-up template is a feature that allows you to customize the content and appearance of pop-up windows in your maps.

Multiple Authors | ArcGIS Solutions | April 30, 2024
Brevard County Fire Rescue improves situation awareness with the Pre-Incident Planning solution.

Kory Kramer | ArcGIS Pro | April 30, 2024
ArcGIS Pro 3.3 requires WebView2 Runtime as an installation prerequisite. Here's how to make sure you have it.
Multiple Authors | ArcGIS Maps SDK for JavaScript | April 29, 2024
Learn how to make your web maps accessible to wider audiences using live regions and descriptions.
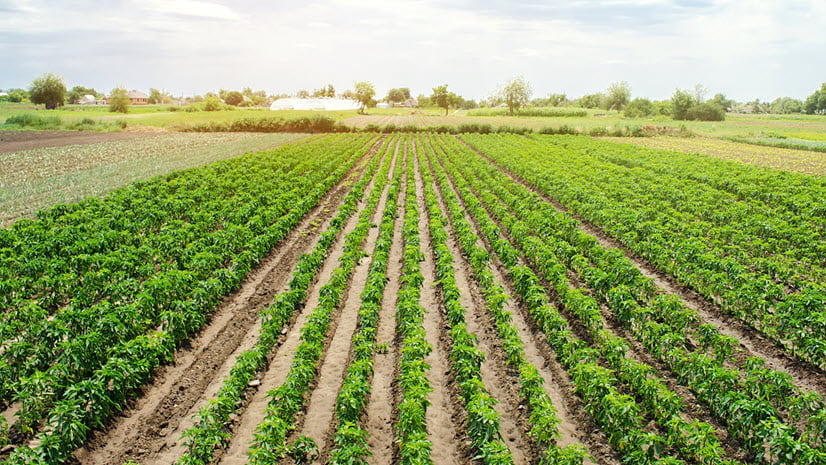
Craig McCabe | ArcGIS Living Atlas | April 29, 2024
The 2022 release of the USDA's Census of Agriculture is now available in the Living Atlas!

Robert Krisher | ArcGIS Utility Network | April 29, 2024
Learn the key concepts and terminology needed to understand how to manage wastewater data using the ArcGIS Utility Network
Multiple Authors | ArcGIS Enterprise | April 29, 2024
TJ Houle from UDC talks about leadership, strategic thinking, networking, and all things GIS.

Multiple Authors | ArcGIS Configurable Apps | April 26, 2024
This article discusses the upcoming ArcGIS Configurable Apps retirement and provides migration resources for users.