displaying
Use # to search tags and @ for authors

By Multiple Authors | ArcGIS StoryMaps |
Share your briefing slides with an interactive image gallery and more with the latest update to the ArcGIS StoryMaps Briefings app.

By Multiple Authors | Developers |
A Developer approach to imagery.
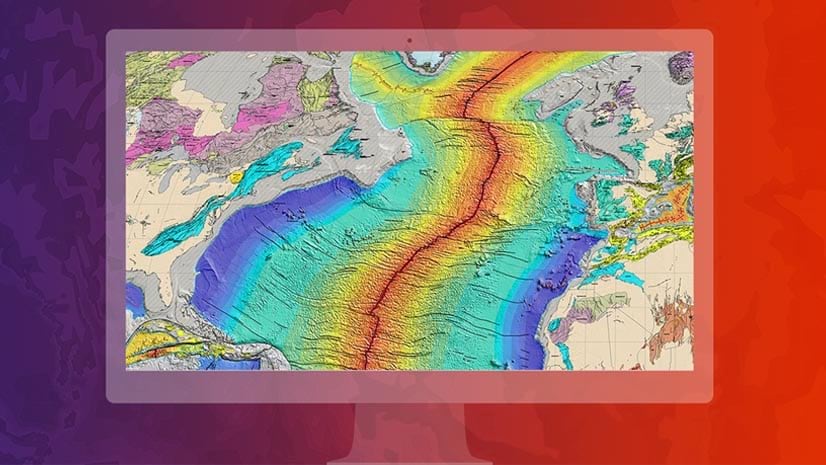
By Shree Rajagopalan | ArcGIS Pro |
Learn how to dynamically produce output data and information products at any scale from a single best-scale data source.

By Field Notes Podcast |
Learn how Napa County's pest management program protects agriculture and contributes to food security throughout the country.

By Lisa Berry | ArcGIS Living Atlas |
Do you have questions about how to access, use, or nominate content within ArcGIS Living Atlas of the World? Check out this blog for answers.

By Multiple Authors | ArcGIS Hub |
Open data provides a foundation for collaboration and community engagement. It helps build trust and focuses discussions on fact.

By Katie Thompson | ArcGIS Urban |
ArcGIS Urban will soon be available with ArcGIS Enterprise, providing planners with a new way to leverage their city's GIS data for planning.

By Multiple Authors | ArcGIS Mission |
ArcGIS Mission 11.3 is coming soon. New features and enhancements bring analyst notes, new admin and user settings, and more!

By Multiple Authors | ArcGIS StoryMaps |
Get storytelling advice and conservation inspiration from the winners of the 2023 ArcGIS StoryMaps Competition.
By Greg Lehner | ArcGIS Pro |
If you receive a notification saying there's a drawing alert: don't panic! Let's solve it together.