Get Started Telling Stories that Inform, Engage, and Inspire
Storytellers often turn to maps to illuminate and contextualize their words. Maps are the visual representation of where events happen. As such, maps and stories complement each other, but until recently they have existed more as side-by-side products and not as one integrated presentation. The big idea of this chapter is that narratives and geography can be combined into one experience: a story map.
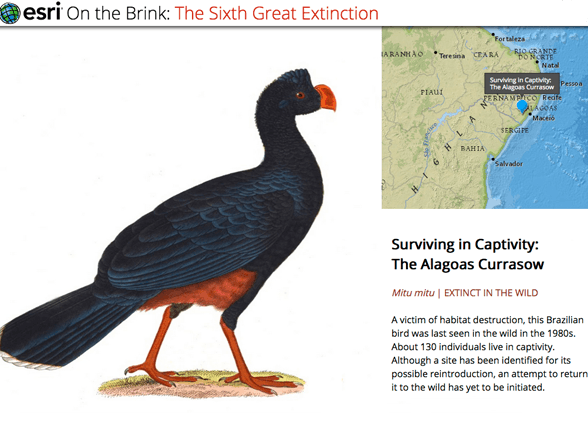 “The International Union for Conservation of Nature’s Red List of Threatened Species has evolved to become the world’s most comprehensive information source on the global conservation status of animal, fungi, and plant species. This story map brings a geographic focus to their critical work, as well as an emotional focus by presenting beautiful paintings of the endangered and extinct species to a broad audience.
Story maps use geography as a means of organizing and presenting information. They tell the story of a place, event, issue, trend, or pattern in a geographic context. They combine interactive maps with other rich content—text, photos, illustrations, video, and audio—within intuitive user experiences. While many story maps are designed for general, nontechnical audiences, some story maps can also serve highly specialized audiences. They use the tools of GIS, and often present the results of spatial analysis, but don’t require their users to have any special knowledge or skills in GIS. This has resulted in a veritable explosion of story maps. (Go to storymaps.arcgis.com to see them come alive.) As you click through to the various story maps linked in this chapter or at the story maps website, take the freedom to immerse yourself in the various narratives. These are information products that reward exploration.
With today’s cloud-based mapping platform, the fusion of maps and stories has finally come of age.
What kind of stories can you tell with story maps?
Describing Places
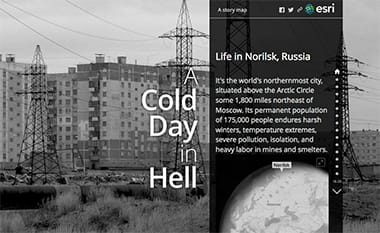 Some maps do the very basic work of describing places. These are the maps we use to explore and navigate the world. Designed for intrepid travelers and armchair tourists, this map of Norlisk, Russia, presents the story of deep cold.
Protecting Lives
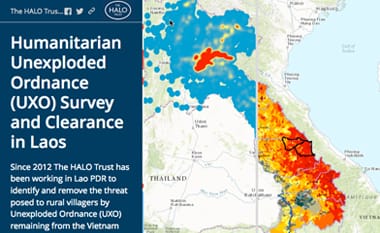 Vietnam remains plagued to this day by unexploded ordnance from the Vietnam War. This story map reveals how the locations of such ordnance continue to affect the people by denying safe access to agricultural land for rural villagers.
Revealing Patterns
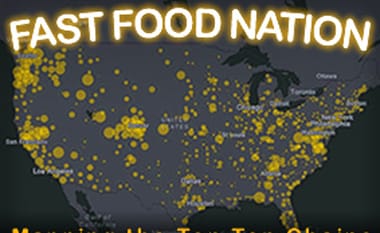 Although many might believe that America’s largest fast-food purveyors are a nationally homogeneous bunch, this story map examines 94,000 locations to uncover the regional truth.
Presenting Narratives
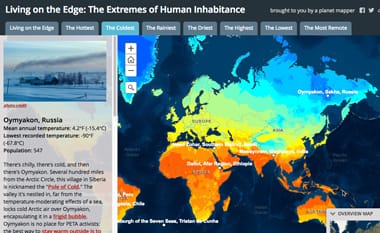 Take a tour of some of the most extreme inhabited regions of the earth, and learn about what it’s like to live there. How do these places compare to where you live?
Visualizing the World
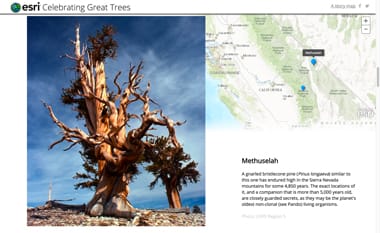 Our planet has countless millions of wonderful trees. On the occasion of Arbor Day, this map tells of a tiny proportion of trees which have gained fame as sacred or historic sites, or as specimens of unusual size, shape, or age—the botanical hall-of-famers.
Celebrating the World
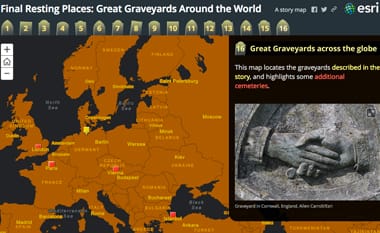 In spite of their literally morbid function, graveyards and cemeteries are among some of the most fascinating locations on the planet, as playfully featured in this Halloween-themed story map.
Tracking the News
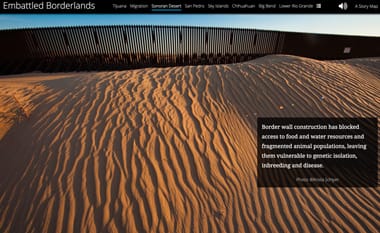 With US border security dominating the news cycles, this story map uses science and spatial thinking to objectively attempt to answer the question: Will the border wall strike a fatal blow to one of the most imperiled wild regions in North America?
Recounting History
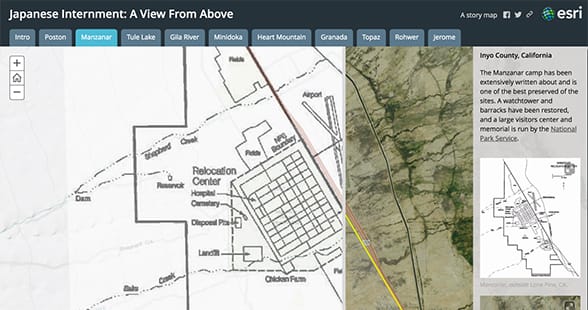
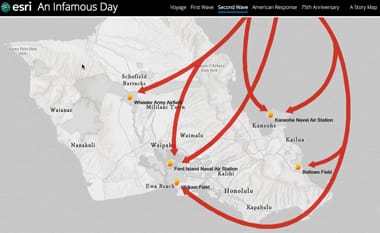 On December 7, 1941, the Japanese launched a surprise attack on Pearl Harbor. This exploration of the actual geography of the attack provides new context for an event that most people assumed they fully understood already.
What kinds of apps are available to help you tell your story?
Story Map Tour: A user experience for place-based narratives
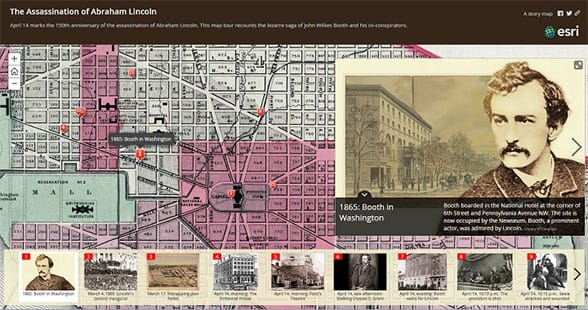 The Story Map Tour app is ideal when you want to present a linear, place-based narrative featuring images or videos. Each “story point” in the narrative is geolocated. Users have the option of clicking sequentially through the narrative or browsing interactively.
Story Map Journal: Create compelling multimedia narratives
 Designed for when you want to combine narrative text with maps and other embedded content, the Map Journal app contains entries, or sections, that users simply scroll through to see associated maps, images, videos, illustrations, or web pages.
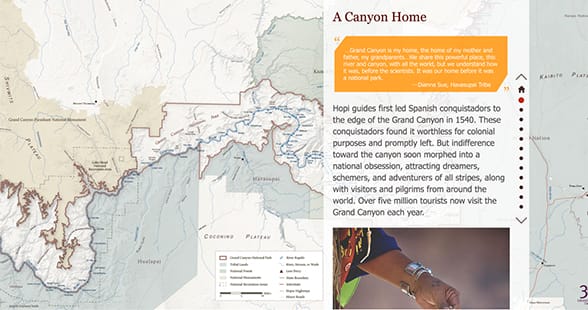
Story Map Cascade: Create immersive scrolling narratives
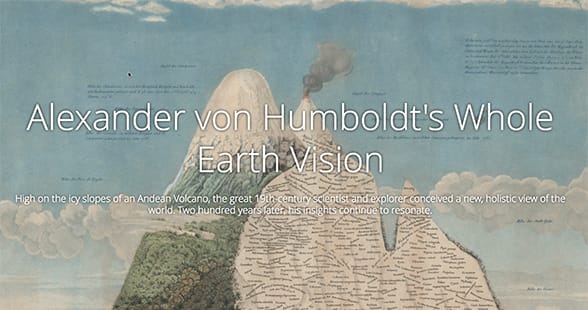 The Story Map Cascade app combines narrative text with maps, images, and other content in an engaging, full-screen scrolling experience. In a Cascade, sections containing text and in-line media can be mixed with “immersive” sections that fill the screen with maps and graphics.
Story Map Series: Make it easy to browse a series of maps
 The Story Map Series app presents a series of maps via tabs (shown above), numbered bullets, or an expandable “side accordion” control. In addition to maps, you can also include images, videos, and web content in your series to help tell your story and engage your audience.
Story Map Crowdsource: Crowdsource your story map
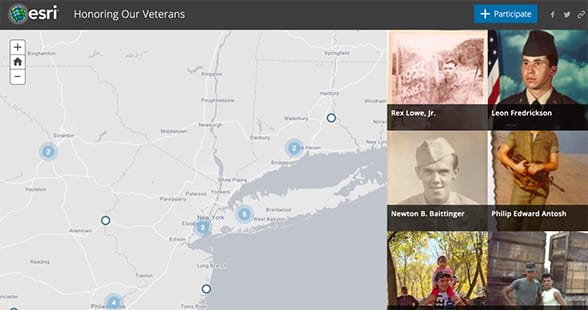 The Story Map Crowdsource app enables you to publish and manage a story that allows anyone to contribute photos with captions. Use it to engage a specific or general audience on any subject. Contributors can sign in with Facebook, Google, ArcGIS, or a guest account.
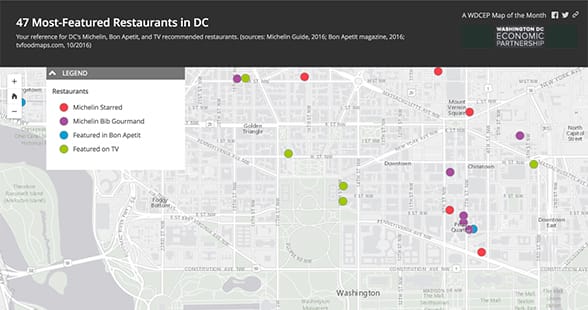
Story Map Shortlist: A fun way to present points of interest
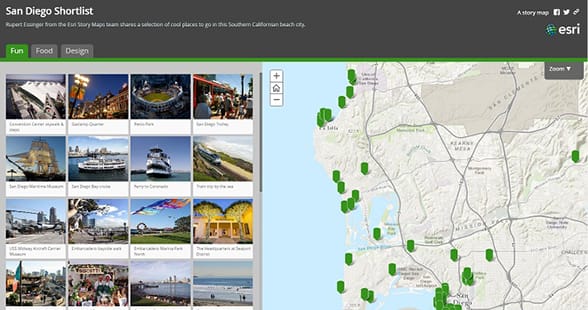 The Story Map Shortlist app lets you organize points of interest into tabs that make it engaging for users to explore what’s in an area. People can click on the places either on the tabs or in the map to find out more about them. The tabs automatically update as users navigate around the map.
Story Map Swipe and Story Map Spyglass: Compare two related maps
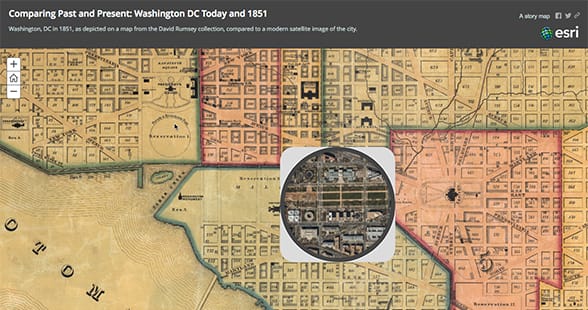 The Story Map Swipe and Spyglass app enables users to interact with two web maps or two layers of a single web map. This allows you to present a single view, or to develop a narrative showing a series of locations or views of the same maps.
Story Map Basic: Let your map speak for itself
Story Map Basic puts all the emphasis on your map, so it works best when your map has great cartography and tells a clear story. You’ll also want to take time to configure good-looking pop-ups, which can include text, images, graphs, videos, and more.
Before you get started, there are a number of things to consider when creating a story map.
Think about your purpose and audience
Your first step is to think about what you want to communicate with your story map and what your purpose or goal is in telling the story. Who is your audience? Are you aiming your story at the public at large, or a more focused audience, including stakeholders, supporters, or specialists who would be willing to explore and learn about something in more depth?
Spark your imagination
Go to the Story Maps Gallery to see some examples handpicked to inspire you and that highlight creative approaches. Filter and search to check out how authors have handled subjects and information similar to your own. Explore. Get a good feel for what makes a good story.
Choose a story map app template
As you saw above, there are a number of different app templates available to help you build your story map. Go to the Story Maps App to browse the app templates and choose the best one for your story map project. Each app lets you deliver a specific user experience to your audience.
Follow the instructions for the app template you choose
See the Tutorial tab for the story map app template you choose for instructions on how to proceed. For example, here is the Tutorial for the Story Map Journal app template.
Share your story map and promote it
When you’ve finished, you simply share your story map to launch it and make it go live. You can share it publicly or restrict it so it can be accessed only by people in your organization. To promote the story map to your audience, you can add links to it, embed it into your website, write a blog post about it, and share it on social media.
Take a lesson on Learn ArcGIS
In addition to the Tutorials mentioned above, several free, hands-on Learn ArcGIS lessons are available to walk you through the process of creating your first story map.
- Get Started with Story Maps: Create web apps that combine maps with multimedia and text.
- Make a GeoPortfolio: Create a head-turning GeoPortfolio of your work.
- Tell the Story of Irish Public History: Gain historical insight by mapping fatalities from Ireland’s 1916 Easter Rising.
- A Place to Play: Find sites for a new park near the Los Angeles River and communicate the results of your analysis in a story map.
—–
This post is excerpted from The ArcGIS Book, Second Edition: 10 Big Ideas about Applying The Science of Where, by Christian Harder and Clint Brown. The twin goals of this book are to open your eyes to what is now possible with Web GIS, and then spur you into action by putting the technology and deep data resources in your hands. The book is available through Amazon.com and other booksellers, and is also available at TheArcGISBook.com for free.

Commenting is not enabled for this article.